Stock Watch: Lloyds Banking Group
Banks are amongst some of the hardest companies to understand. I know of many professional investors who will not buy the shares of banks because they do not understand them. By that I mean that they do not fully understand their assets and their liabilities.
The 2008 financial crisis exposed many banks for how complicated their assets and liabilities were. Even the banks themselves didn't really know how much they owned and how much they owed. Shareholders found out to their cost that the value of bank assets was often a lot less than they thought and their liabilities were often bigger. In many cases there was little or no money left over for them.
Many banks had to be rescued by governments or shareholders in order to stop the financial system from collapsing. Billions of pounds were pumped into them in order to shore up their shaky finances. Since the dark days of 2008, banks have had to change their ways and start obeying lots of new rules. They have had to cut back on risky and complicated financial transactions and hold more money to protect them if things go wrong again in the future.
In many cases these new rules have made banks less risky investments than they were before. But they have also made banks less profitable. So where does this leave bank shares as potential investments?
In this article, I am going to show you how you might go about weighing up a bank in SharePad. We've added some extra financial data to help you understand them better. I will take you through some of the key numbers by looking at the simplest bank listed on the London Stock Exchange - Lloyds Banking Group (or LBG).
Phil Oakley's debut book - out now!

Phil shares his investment approach in his new book How to Pick Quality Shares. If you've enjoyed his weekly articles, newsletters and Step-by-Step Guide to Stock Analysis, this book is for you.
Share this article with your friends and colleagues:
How Lloyds makes money
LBG makes money from four main areas of activity:
- Providing services such as loans, current accounts, savings products and mortgages to retail customers via high street banks and internet banking.
- Commercial banking services to businesses.
- Consumer finance - things such as the provision of credit cards and finance for motor cars.
- Insurance - house and life insurance policies, investment and income protection products.
Let's see how the income and the costs from these activities show up in LBG's income statement.
Interest income
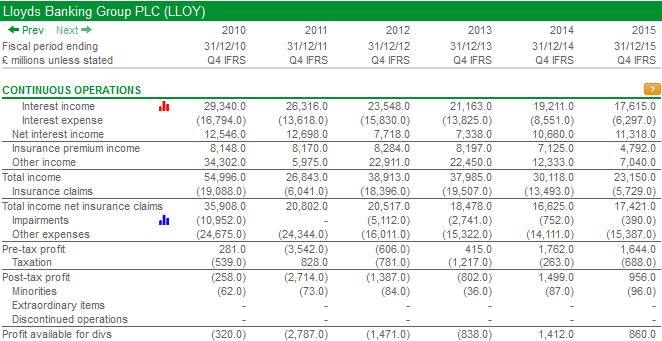
LBG makes most of its money from lending money to customers. The money it lends out in loans attracts interest paid by the borrower. This is known as interest income. As you can see, the amount of interest income has been steadily falling since 2010. This can be explained by a decrease in the amount of loans outstanding and a decline in the interest rate that it charges on those loans.
Interest expense
Simple banking involves taking money from savers (or depositors) and lending it out to borrowers. In order to get people to deposit money with them a bank has to offer them an attractive interest rate. Banks also borrow money from the money markets (known as wholesale finance). The interest paid to depositors and wholesale lenders is a cost of doing business and is shown as an expense on the income statement.
LBG's interest expense has fallen significantly in recent years. This is mainly due to the fact that interest rates in general have fallen to record lows. Banks can borrow money for virtually nothing as anyone with a savings account will tell you.
Net interest income
This is the difference between a bank's interest income and interest expense. It is a key measure of a bank's profitability and is very similar to a non-financial company's gross profit. Ideally you want to see this number growing every year. After falling sharply in 2012, LBG's net interest income has seen a healthy increase during the last couple of years.
Insurance premium income
This is income earned from selling insurance policies during the year. This source of income has been declining in recent years.
Other income
This will include income from fees and commissions from banking services as well as trading income from trading financial assets and securities.
Banking costs
Like all companies banks have to incur costs to generate their income. The biggest costs are wages and other staff costs as well as items such as rents, IT costs, advertising and regulatory costs. A large chunk of a these costs are fixed and do not vary with a bank's income. These costs are included in the "other expenses" row in SharePad. In there you will also find one-off costs such as provisions for fines. For example, those to do with the mis-selling of payment protection insurance (PPI) which totalled £4bn in 2015.
Impairments occur when a bank realises that a total amount of a loan or outstanding investment cannot be recovered in full and has to be written down to its recoverable amount. This writing down of value is shown as an expense in the income statement. Following the financial crisis, LBG incurred some big impairment expenses but the value of these has fallen significantly in recent years as bad loans have disappeared from the company's balance sheet.
Insurance companies have to pay out against claims each year. In some years, the value of claims can be bigger than the insurance premium income earned and a loss can be made from insurance activities. LBG has suffered some years of big losses and made a small insurance loss in 2015.
Profits
When all these sources of income and costs are considered together you arrive at a bank's pre-tax profit. For LBG this was just over £1.6bn - a slight decline from the year before. According to LBG's 2015 annual report its underlying pre-tax profit (which excludes one-off costs such as provisions and restructuring costs) was £8.1bn - a big difference.
Which profit figure should you use?
Well it depends if you believe that a lot of LBG's costs are genuine one-offs or not. PPI will not be an issue very soon but restructuring costs and provisions can happen more frequently. We will look at this issue later when looking at LBG's financial returns and valuation.
Profit ratios
SharePad has added a couple of new profit ratios to help you understand a bank's performance better. These are the Net interest margin and Cost to income ratios.
Net interest margin
This compares the bank's Net interest income with the average value of its interest-bearing assets (loans). In SharePad, we do not know which loans bear interest and which do not so we assume that all of them do. To get the average, we add the value of loans over two financial years and divide by two.
SharePad calculates LBG's net interest margin as 2.3% whereas Lloyds annual report gives a figure of 2.63%. This will be down to the loans value. As with most ratios it is not always the absolute number that matters rather than the trend or direction of travel of it.
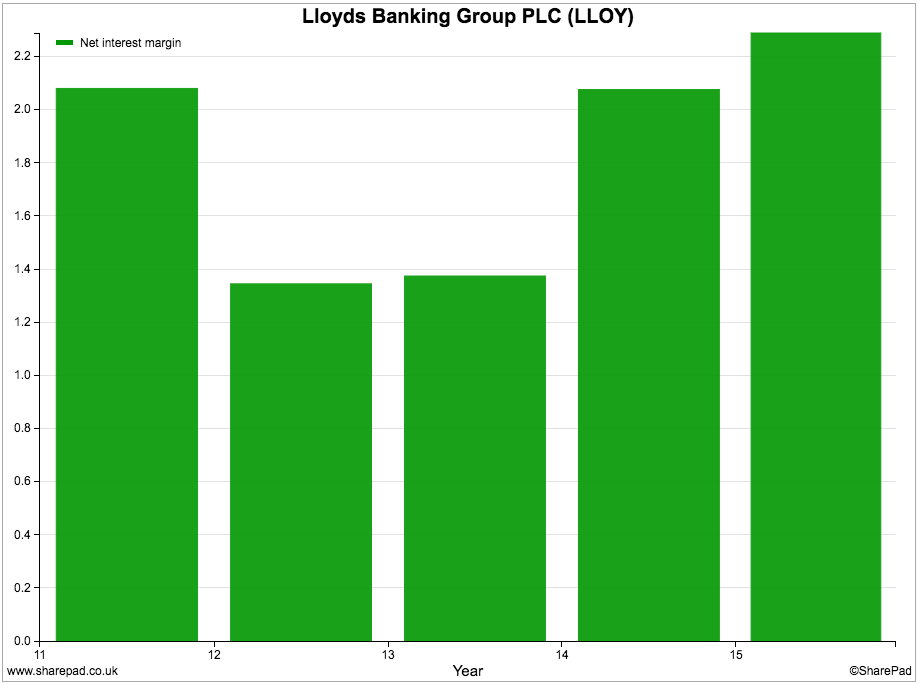
The good news for LBG and its shareholders is that the trend is upwards as the company has kept the rate of interest paid to savers (its interest expense) low whilst at the same time getting rid of low interest-paying loans. This trend is expected to continue in 2016.
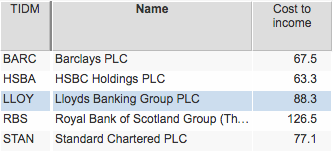
Cost to income ratio
Cost control is a key driver of a bank's profitability, even more so when growing income is quite difficult. The Cost to income ratio is an important measure of how good a bank is at controlling its costs. It is calculated in SharePad using the following formula:
Cost to income ratio = Operating costs/Income net of insurance claims
The lower this number, the better.
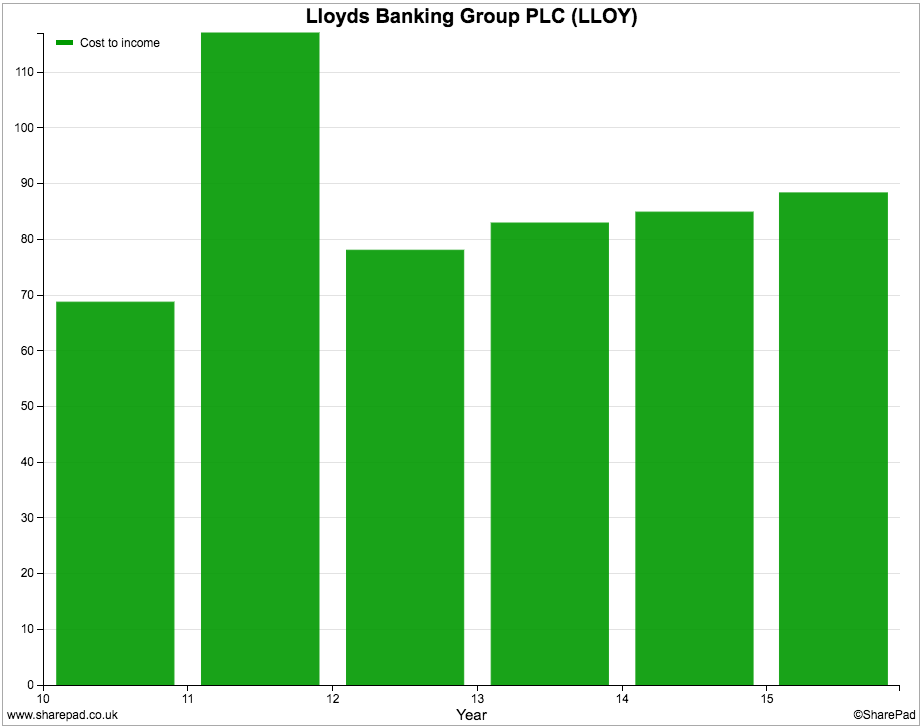
As you can see, LBG's cost to income ratio has been rising for the last three years and was a very high 88.3% in 2015. What a high ratio tells you is that there are some hefty costs to investigate. In LBG's case there have been a lot of large exceptional costs such as PPI compensation costs. On an underlying basis, LBG's cost to income ratio is very commendable 49.3% and is expected to reduce further in 2016.
How safe and how good are banks as investments?
Many investors got their fingers badly burned by owning banking shares during the financial crisis. They found out the hard way that, when times got tough, a lot of banks weren't very safe at all. There are a number of ratios you can look at to check out if the finances of a bank are shaky or not.
Before we start looking at these it is useful to have a look at a bank's balance sheet.
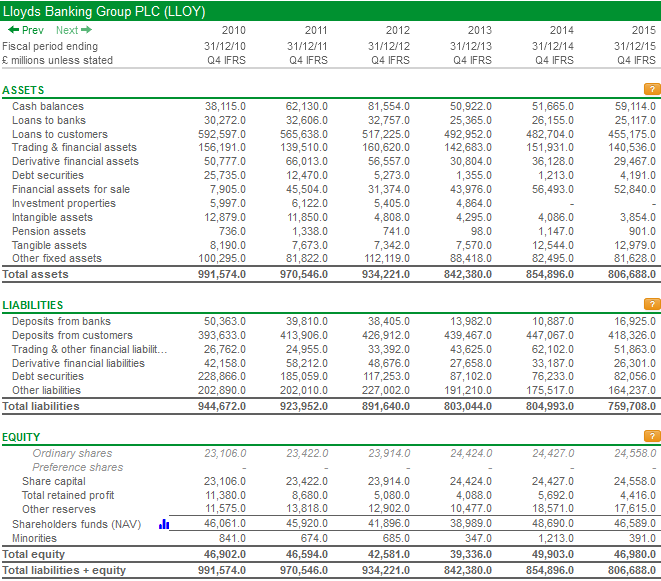
There are four things to take away from LBG's balance sheet:
- A large proportion of its assets are made up loans to customers and other banks.
- Deposits from customers and banks make up a large proportion of liabilities.
- Equity is quite small relative to the bank's total assets.
- There are still some significant derivative assets and liabilities. Trying to fully understand the potential risks here is very difficult for the private investor.
Loan to Deposit ratio
How a bank finances its loans is very important from a risk perspective. Ideally you want to see all of a company's loans financed by deposits from savers. Deposits tend to be quite sticky and don't tend to move around too much which makes them a very reliable and stable source of finance for a bank.
During the run up to the financial crisis many banks over-extended themselves by issuing more loans to try and make more money. This led to some having more loans than they had deposits - with banks borrowing on the money markets to finance the lending. When the financial crisis hit many wholesale lenders wanted their money back and called in their loans. This is why banks such as Northern Rock got into big trouble and had to be rescued. LBG and Royal Bank of Scotland also over-extended themselves.
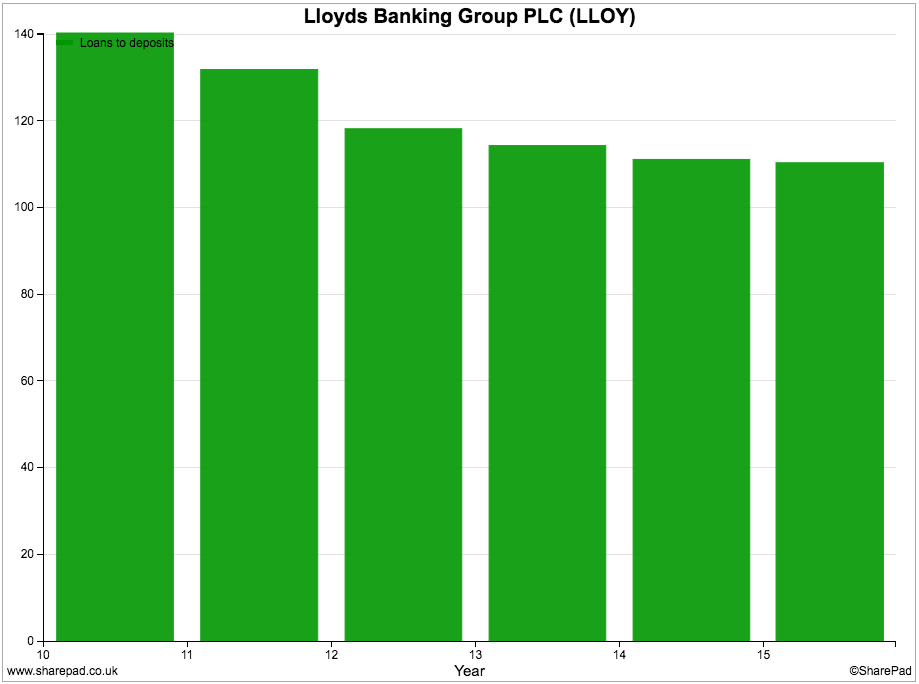
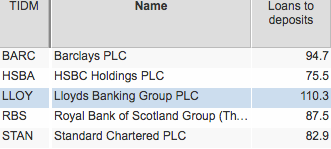
LBG's loans to deposit ratio has been coming down but is still over 100%. This is telling you that the bank is reliant on some outside borrowing to fund its loans. This is not ideal but the bank says in its annual report that it has liquid assets (things it can turn into cash quickly) to pay off its wholesale financing.
Compared to the other big listed banks, LBG has the worst loans to deposits ratio. On this measure, HSBC looks to be the safest bank.
Tier 1 Equity ratio
SharePad doesn't calculate this ratio but many investors look at it in order to work out how safe a bank is. The ratio compares what is known as tier 1 capital as a percentage of a bank's risk weighted assets (RWA).
RWA's are the assets that are used to work out the minimum amount of capital a bank must hold in order to protect its creditors and reduce the risk of it going bust. Each bank asset - such as a loan - is assessed according to its risk and given a weight. For example a personal, unsecured loan is more risky than a mortgage which is secured against the value of a property.
A bank also has to match its capital against certain types of assets so that it doesn't get into trouble if one particular class of asset suffers from a big fall in value.
Below is a screenshot from Lloyds' 2015 annual report which shows you how the components of the tier 1 ratio are calculated.
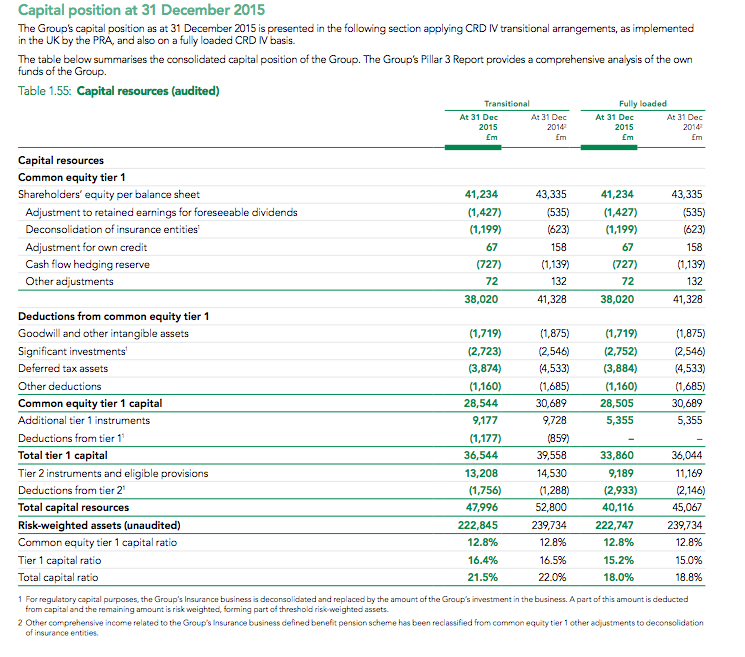
Tier 1 equity capital of £28.5bn is based on the value of shareholders' equity less adjustments. Risk-weighted assets are £222.9bn - just over a quarter of total assets - giving a tier 1 equity ratio of 12.8%. This is well above the minimum level demanded by banking regulators of 6% which suggests that LBG is quite safe at the moment and has enough capital to protect itself from unexpected shocks.
Assets to Equity ratio
Tier 1 ratios are quite complicated and can be quite daunting for investors. A simpler measure of safety is the Assets to equity ratio which compares the value of total assets with the value of total equity. The bigger the ratio the more debt a bank has relative to its assets and therefore the more risky it might be.
Whilst not as sophisticated as the tier 1 ratio, it is simpler to calculate and understand. One of the best ways to understand it is to compare it with buying a house with a mortgage. Let's say that you buy a £100,000 house with a £95,000 mortgage and £5,000 of your own savings. Your asset to equity ratio is 20 (100 / 5).
If you look at LBG you can see that it had lots of debt - or leverage - in the run up to the financial crisis which eventually saw the assets to equity ratio peak at over 45 times. In order to make themselves less risky banks such as LBG have been deleveraging since then with assets to equity less than 20 times now.
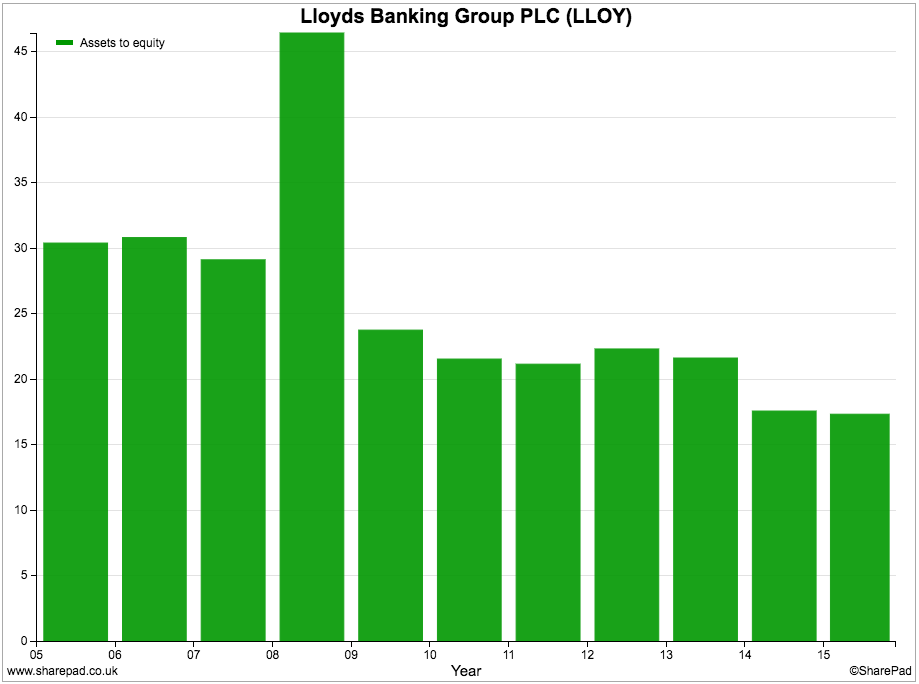
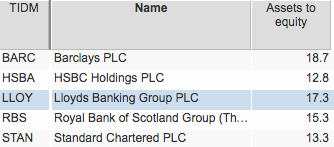
That said, LBG still has more debt - less equity - compared to most of its peers.
Less leverage means lower returns for shareholders
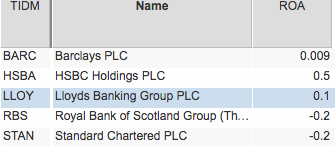
The simple truth of the matter is that banks are not very good businesses compared to the many options available for investors out there. I say this because banks don't make very high returns on their assets (Profits after tax / Total Assets). LBG's return on assets (ROA) was just 0.1% in 2015 or 0.98% if all the one-off expenses are ignored. There are many good businesses out there with ROAs of more than 10%.
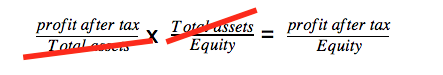
Because the return on assets is so low, banks are forced to take on lots of debt to create new assets (loans) in order to make acceptable returns for shareholders - measured by return on equity (ROE). This increase in gearing (leverage) increases the assets to equity ratio. If you multiply a company's ROA by its assets to equity ratio then you get a company's return on equity as a bit of simple school maths below proves.
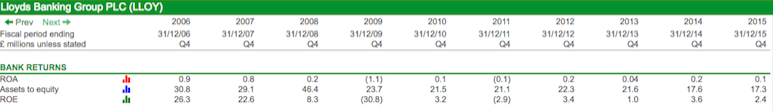
The table above is very revealing about LBG's ROE history. The higher assets to equity ratio and higher ROE before 2009 shows that it was only able to make decent returns for shareholders by taking on lots of debt and lots of risk. When profits collapsed with the financial crisis, ROE collapsed as well. Since then the Return on assets has not recovered whilst the amount of leverage has come down a lot which has meant that LBG has not been able to deliver consistently good returns on equity.
However, if all the one-off costs are ignored, LBG says that its underlying ROE was 15% in 2015. The bank reckons it is capable of making ROEs of 13.5% to 15% over the long haul. We'll come back to this number shortly when looking at how to value bank shares.
How to value bank shares
Most professional analysts value bank shares based on their Net asset value (NAV) per share. The approach is very similar to valuing housebuilder shares (click here to read more on this topic).
The key to valuing banks is to try and determine the right Price to NAV (P/NAV) multiple for a share by estimating the company's sustainable return on equity (ROE) and comparing it with the returns required by shareholders to invest in the company - known as the cost of equity (COE).
This required return or cost of equity is one of the most hotly debated topics in finance. There's no right answer to what number it should be. I'm not going to get into this topic right now but most professional investors assume that it is around 8%. For banks, you might want to add on a little bit extra given the risks involved to say 10%.
Getting back to the P/NAV multiple, the logic here is that a share is only worth its NAV per share if the company can produce an ROE that is equal to or more than the cost of equity. So if the sustainable ROE is 10% then the estimated P/NAV is worked out by dividing the ROE by the COE:
P/NAV = ROE / COE = 10% / 10% = 1.0
If the sustainable ROE was 16% the P/NAV would be:
16% / 10% = 1.6
If the sustainable ROE was only 4% then it would be:
4% / 10% = 0.4
So we now have some simple rules:
- ROE > COE then P/NAV > 1.0
- ROE = COE then P/NAV = 1.0
- ROE < COE then P/NAV < 1.0
So if you were looking at a share with a sustainable ROE of 12% and a cost of equity of 10% and an NAV ps share of 100p this is how you would work out a value for the share:
Implied P/NAV = 12% / 10% = 1.2
Value per share = NAVps x P/NAV = 100p x 1.2 = 120p
You get a value for the share by multiplying the NAV per share by the estimated P/NAV.
You can quickly do this in SharePad by using the target price calculator in the Investor tools section. Let's say that LBG can make a sustainable ROE of 15% and investors want 10% to invest in the shares. Given the trailing twelve month (TTM) NAV per share of 57.7p and a P/NAV of 1.5 (15% / 10%) we get an estimated price of 87p for LBG's shares.
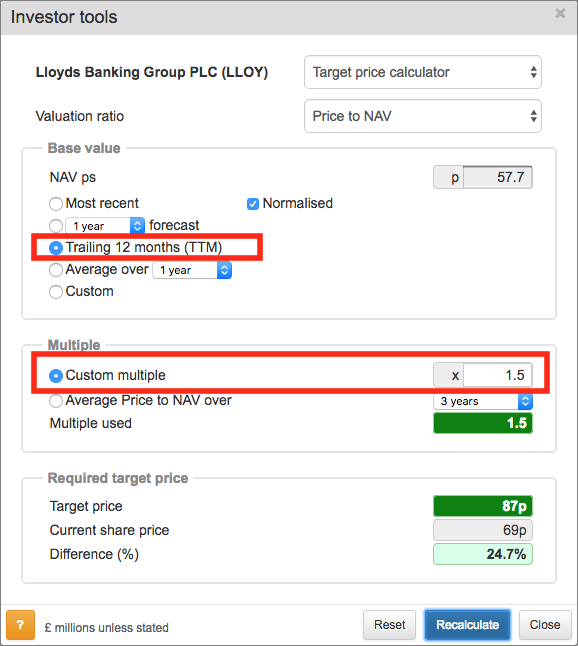
This gives an upside, at the time of writing, of 24.7%. If you were to use a sustainable ROE of 13.5% and a P/NAV of 1.35 (13.5% / 10%), the price target would fall to 78p. If the average P/NAV multiple of the last 10 years was used the target would fall to 69p (the share price at the time of writing).
The value of future dividends
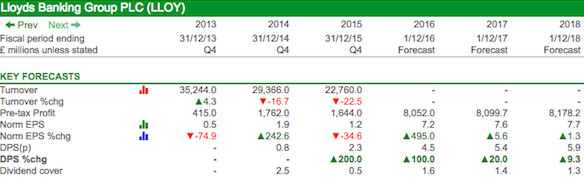
LBG has recently started paying dividends again. If its business stays in good health then City analysts expect it to pay some big dividends over the next few years. If I use the dividend valuation model in SharePad (also found in the Investor tools section) then I can get another estimate of how much LBG's shares might be worth.
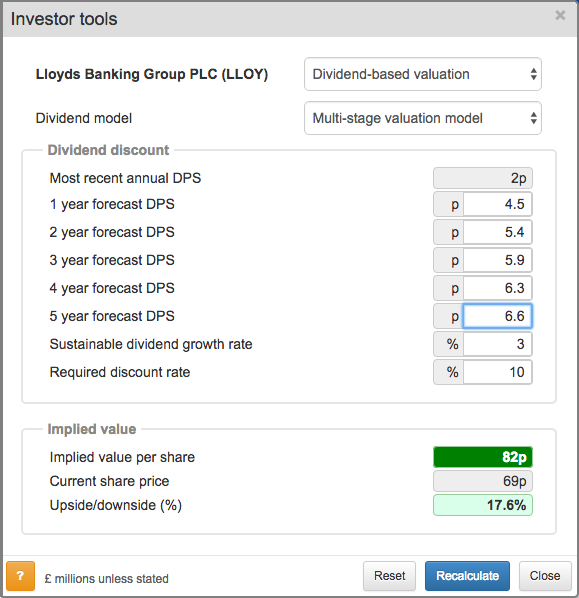
Look at the screenshot below. SharePad pre-populates the dividend per share forecasts for the next three years. I have then entered dividends for years four and five. I have based these on lower growth rates of 7% and 5% respectively - for a more cautious estimate. After that, I assume that dividends grow at 3% forever. Assuming a required return (called discount rate in SharePad) of 10% gives me an estimated value per share of 82p.
Of course, these projections might be worthless if the UK economy goes into recession and the housing market falls - causing loans to go bad. If you want to use this tool to value a share then you need to make sure that your forecasts are realistic and sensible.
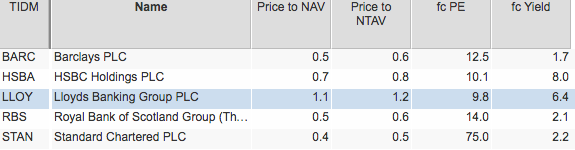
Valuation compared with other banks
LBG is the most expensive of the big banks on a P/NAV basis but is the cheapest on the basis of forecast PE. Along with HSBC, it also offers a very big dividend yield.
LBG's future prospects
As well as crunching numbers, it is important to try and understand LBG a little better in order to weigh up its future prospects. As with all companies, you want to try and find out if profits can grow in the future.
City analysts don't seem to think so. Whilst they expect the one-off costs to disappear, underlying pre-tax profits are expected to stay at around £8.1bn for the next three years. Earnings per share is expected to grow slightly whilst most of the company's profits are expected to be paid out in dividends.
LBG and other banks face a number of challenges. Firstly, there is a lot of competition for loans and savings accounts in the UK. This could limit LBG's ability to grow its loans but also restrict the interest rates they can charge.
Low interest rates are another potential threat. In some countries, the interest rates on government bonds have turned negative. If that was to happen in the UK - not likely at the moment - or interest rates were to fall further it would make it more difficult for LBG to write profitable loans.
The bank also has a significant exposure to the UK housing market as one of the country's biggest mortgage lenders. A fall in house prices would slow down the growth in mortgages but it seems that LBG has a relatively safe portfolio of mortgages as shown below.
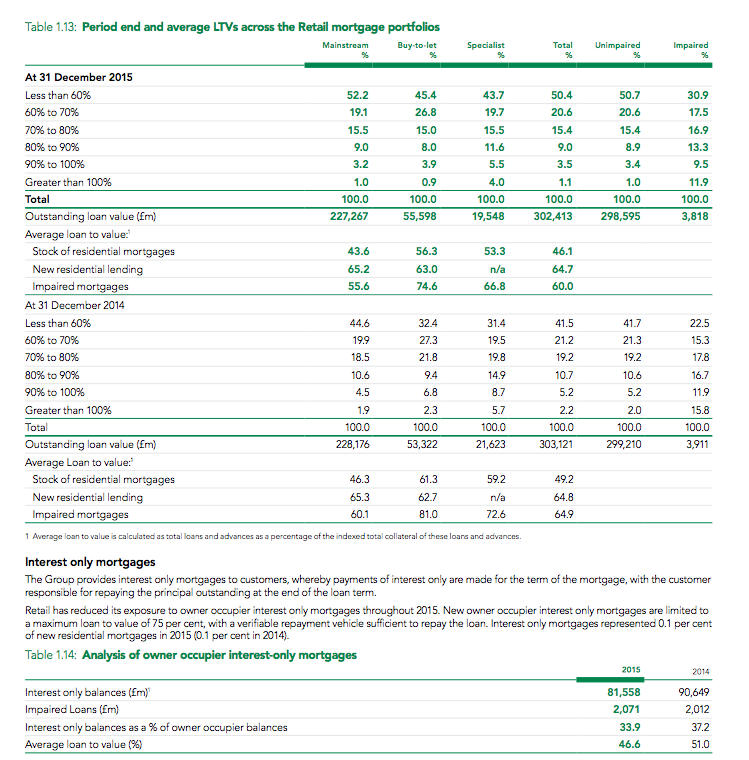
Most of LBG's mortgages have a loan to value (LTV) ratio of less than 80%. Over half of them have a LTV of less than 50 and the average is just 46.1%. House prices will have to fall a long way before the value of these loans are in danger of being written down and profits take a hit.
That said, there is still some risk. Out of total mortgages of over £300bn, 4.6% of them have a LTV of 90% or more. Problems in the housing market could still hit profits in the years ahead.
However, it would seem that LBG is taking a very cautious approach to lending. Mortgage lending has not grown at all in 2015 as the market has become very competitive. LBG has seen some growth from buy-to-let mortgages but has grown its mortgages slower than the overall market.
The other possible risk is interest-only mortgages account for over a third of its residential mortgages. The average LTV is 46.6% but problems could be caused with higher LTV mortgages if house prices fall and borrowers default on their mortgage payments.
To sum up
- Banks aren't the easiest businesses to understand - it can be quite difficult to understand their assets and liabilities.
- To analyse banks you need to use different ratios compared with non-financial companies.
- LBG's net interest margin has been improving,
- Its costs have been rising due to one-off costs such as PPI. Underlying costs to income have fallen.
- LBG is still reliant on wholesale financing rather than deposits to fund some of its loans.
- LBG's finances are a lot safer than they were a few years ago.
- Less leverage has meant lower returns to shareholders.
- LBG has a big mortgage business and could suffer if UK house prices fall.
- City analysts are not expecting much profit growth from LBG.
- The best valuation measure for a bank is probably Price to NAV (P/NAV).
- You can determine the right P/NAV ratio by considering a sustainable ROE.
If you have found this article of interest, please feel free to share it with your friends and colleagues:
We welcome suggestions for future articles - please email me at analysis@sharescope.co.uk. You can also follow me on Twitter @PhilJOakley. If you'd like to know when a new article or chapter for the Step-by-Step Guide is published, send us your email address using the form at the top of the page. You don't need to be a subscriber.
This article is for educational purposes only. It is not a recommendation to buy or sell shares or other investments. Do your own research before buying or selling any investment or seek professional financial advice.