How much is a company worth? A look at different ways to value shares
Two weeks ago I wrote about how to try and value companies that aren't making a profit. This week I'm going back to basics for more inexperienced investors. Although I'm sure there will be some reminders here for regular readers.
For many successful investors, the price they pay for a share of a company is of the utmost importance. For short-term investing strategies the price paid can often take a back seat in the process, but for those with a long term perspective the price they pay usually has a big say in how much money they will ultimately make.
Paying too much for a share can lead to disappointing long-term returns from shares even if the company behind them is still growing its profits. This happens because expensive valuations point to a rosy future for a company with high rates of expected profits growth. If those profits don't grow as quickly as people had hoped for the share price can fall and money can be lost.
This doesn't mean that people should only stick to buying shares with low valuations. Buying a share because it looks cheap is often just as bad as paying too much. Cheap shares are often cheap for a very good reason as they are attached to businesses with poor growth prospects or ones facing big problems. They also have a nasty habit of becoming cheaper still.
I often explain the valuations of shares to friends by comparing them to bottles of wine. In many cases, cheap bottles of wine are often disappointing purchases as they are not particularly nice to drink. It is far more satisfying to buy better bottles of wine when they are on offer. Benjamin Graham, the famous investor, said something similar when he advised people to buy their shares in the same way they bought their groceries.
It is also true that paying a high price for a bottle of wine is no guarantee that you will enjoy drinking it. You may end up thinking that it is very poor value for money. This is the same as buying an overpriced share of a good business.
But what determines whether a company's shares should be priced like a vintage wine or a bottle of cheap plonk?
The value of a company and its shares essentially boils down to three key things:
- Is it a good or bad business?
- The rate of expected profit growth.
- The interest rates available on alternative investments such as savings accounts or government bonds.
Good businesses with high rates of profits growth should therefore see their shares command higher valuations than poor businesses with low rates of growth or shrinking profits. If interest rates are low, valuations of shares will tend to be higher than when interest rates are high - because they look more attractive to investors. We have been in a low interest rate environment for many years now but it might not stay this way.
All investors are trying to do the same thing. They are trying to buy the shares of businesses for less than they are ultimately worth. But how do they go about working out whether shares are cheap or expensive?
The truth is that this is often not easy. Value is in the eye of the beholder and two people will often come up with wildly different estimates of how much a company's shares should be selling for.
In this article, I am going to show you some of the tools you can use to try and answer this hugely important question. Many of these tools are available in SharePad. One or two are a bit more advanced but are not something that should be beyond a diligent investor.
As with many things to do with investing there are no right answers here. However, you must remember you are not trying to be 100% accurate but rather trying to work out whether the odds are in your favour.
Phil Oakley's debut book - out now!

Phil shares his investment approach in his new book How to Pick Quality Shares. If you've enjoyed his weekly articles, newsletters and Step-by-Step Guide to Stock Analysis, this book is for you.
Share this article with your friends and colleagues:
Valuing the shares of Greene King (LSE:GNK)
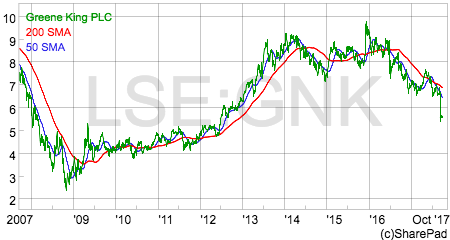
To try and make this as easy as possible, I am going to take the shares of a business which is very easy for most people to understand. Greene King makes beer and owns and runs pubs. Its shares are on a bit of a downer at the moment and are trading at around a five year low as shown in the chart below.
So let's have a go at trying to work out whether Greene King shares are the equivalent of a half decent or very good bottle of wine on offer or something that might get poured down the kitchen sink.
First things first - Check out the quality of the business
Before you even start to try and work out what a company might be worth you need to work out whether you are looking at a good, bad or modest business.
In my opinion, the quickest and best way to get a feel for this is by looking at how profitable it is. To really know if a business is good or bad you need to spend some time understanding what it does and what its prospects are.
Arguably the best measure of profitability is the return on capital employed (ROCE) which looks at a company's trading profits as a percentage of the total amount of money invested in it. This is the equivalent of an interest rate on a savings account. Here are some rough rules of thumb for interpreting a company's ROCE:
- Poor businesses - less than 5%
- Modest businesses - 5% to 10%
- Fairly good businesses - 10% to 15%
- Very good businesses - 15% to 20%
- Outstanding businesses - more than 20%
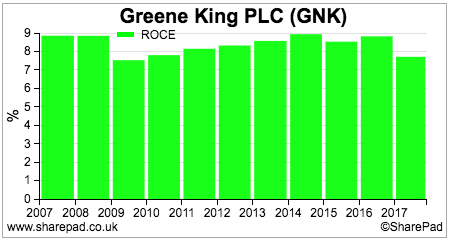
Using ROCE as a measure of quality, it seems that Greene King is fitting into the description of a modest business.
Step 2: A quick glance at the share price chart
Share price charts are a great way of quickly learning about what the stock market currently thinks about a share. Rising share prices tell you that something good is happening whilst falling share prices might be telling you that the company is having a bad time of things.
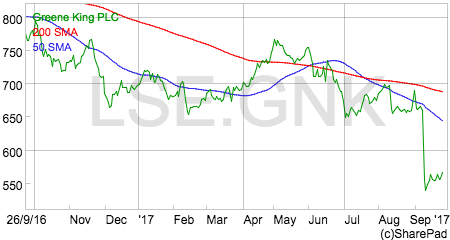
We already know from the first chart above that Greene King shares are trading close to a five year low which is not a good sign. Looking at the one year share price chart shows a recent sharp fall in the share price. The share price is also below its 50 day and 200 day moving average - an often used measure of sentiment - which is also painting a very grim picture.
You now need to go and find out why this is happening. The most obvious reason is bad news about the company's trading performance or difficulties with similar companies in the pub sector. Go to the company's investor relations website or check out the News view in SharePad.
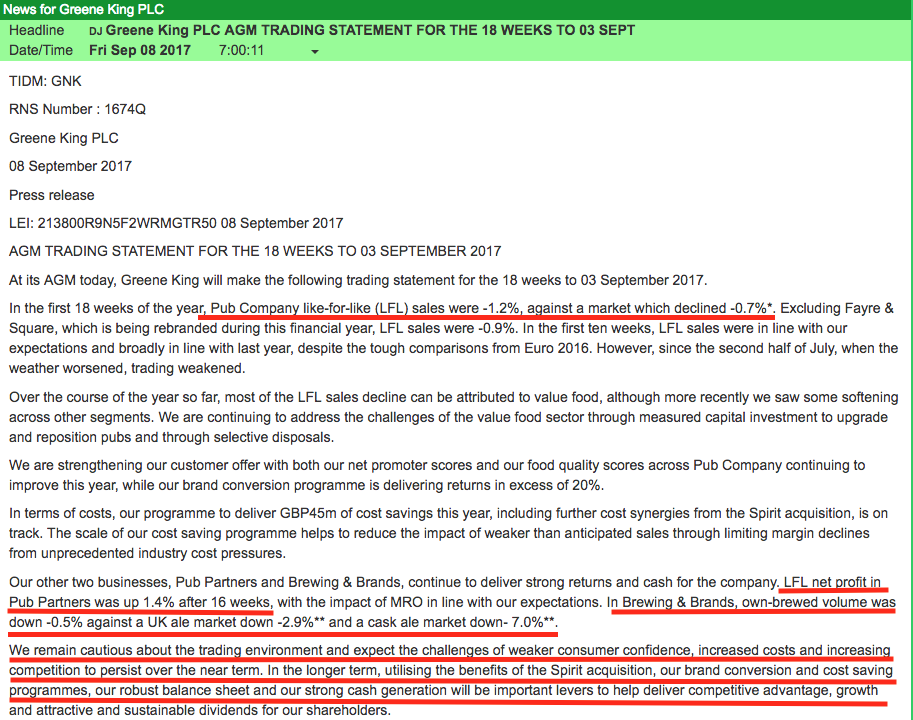
The reason for the sharp fall in the share price was a fairly poor trading statement on 8th September 2017 which said:
- Underlying sales at the Pub Company have been falling and at a faster rate than the pub market as a whole. This means the company is losing market share which is not a good sign.
- Pub Partners' profits are growing by a small amount.
- Brewing sales are falling but by less than the market. Greene King is taking market share in a falling market which is a small comfort.
- The short-term outlook is poor due to weaker consumer confidence, higher costs and increasing competition. That's a pretty worrying mix of circumstances.
- The company is still upbeat longer term and is confident it will have enough cash flow to grow the business and deliver sustainable dividends - note it did not say growing - to shareholders.
Not a lot to be cheerful about here it would seem.
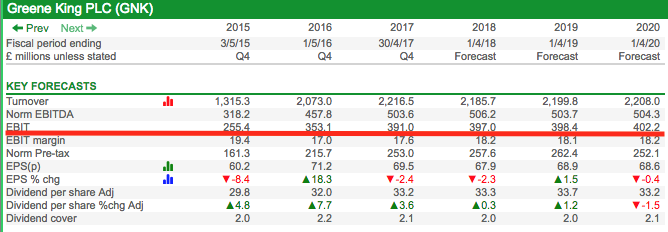
Step 3: What are the growth prospects?
We already know from step 2 that the short term outlook is poor. City analysts are often bad at predicting future profits but it's always worth looking at what they are expecting to get a feel of whether things are likely to get worse or better.
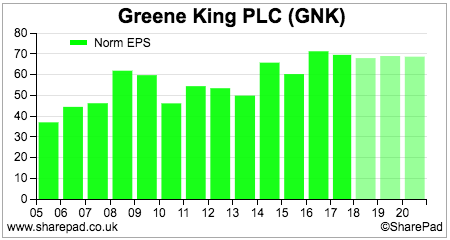
We can see here that Greene King has been struggling to grow its profits for shareholders (earnings per share or EPS for short) recently and is not expected to increase them for the next three years.
Taking stock: What you already know
In a very short period of time you have learned three very important things about Greene King that will help you when you are trying to work out whether its shares are cheap or expensive.
- It appears to be a very modest business rather than a good or very good one.
- Current trading is poor.
- Profits aren't expected to grow much.
Now ask yourself is this the kind of business that people should be prepared to pay a high price tag for. My guess is that most people would not be willing to.
So there are good grounds for expecting the shares to trade at fairly low or modest valuations. That's the important valuation question answered.
The second one is whether you think the stock market is right. Are Greene King shares still overvalued after their recent fall or has the market judged them too harshly and served up a potential bargain?
Valuation tools
There are three main approaches to valuing a company and its shares:
- Multiples of profits, cash flows or assets - the higher the multiple the more expensive a share is. Examples include PE ratios, Price to Free Cash Flow (P/FCF) multiples and Price to Net Asset Values (P/NAV).
- Yields - interest rates used to compare with other or similar investments. High yields are a sign of cheapness whilst low yields are a sign that a share might be expensive. Common examples are dividend yields, earnings yields and EBIT yields.
- Absolute valuations - when you estimate a per share value for a company. Examples include a dividend discount model (DDM), discounted cash flow (DCF) or a sum-of-the-parts (SOP).
To value Greene King shares I am going to discuss the following valuation techniques:
- Price to earnings (PE) multiples
- EBIT yield
- Dividend yield
- Dividend discount model
- P/NAV
- Earnings power value (EPV)
- Sum-of-the-parts
PE multiples
This is the most commonly used valuation yardstick as it is very easy to calculate with information that is usually quite easy to find. It is simply the share price divided by the earnings per share (EPS).
The problem for investors is what EPS number to base their valuation on. The most common ones used are:
- Historic PE based on the company's last annual year end reported EPS. Often referred to as just PE.
- Trailing twelve month (TTM) PE based on last 12 months EPS. If a company's last results were for a half year, the TTM EPS will take the recent half year figure and the second half EPS of the previous year.
- Forecast PE - based on next annual forecast EPS
- Rolling PE - This is my preferred PE measure. It looks at PE based on an estimated current year to date rather than year end EPS. This helps to better compare companies with different year ends. So for Greene King which has an April year end, its rolling EPS at the end of September 2017 will have 7 months of the last annual EPS of 69.5p (September 2016 to April 2017) and five months of this year's forecast EPS of 67.9p (May 2017 to September 2017). This gives a rolling EPS figure of 68.8p.
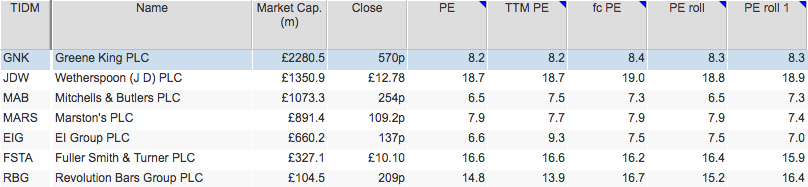
At a share price of 570p, Greene King trades on a rolling PE of 8.3 times. Looking forward another year it is on the same multiple. These are not high numbers and seem to reflect the company's current struggles.
Once you have this number you might want to compare it with its historic range. SharePad can calculate a rolling PE chart for you.
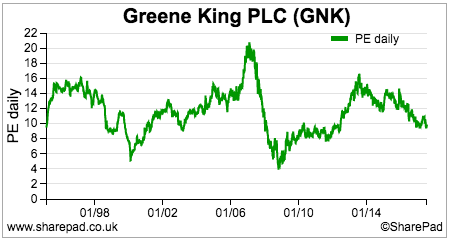
We can see that the company's rollling PE has been getting lower for the last three years which reflects a growing lack of enthusiasm for the shares. The company was cheaper on this measure (a lower PE) coming out of the last recession and during the technology boom of the late 1990s and early 2000s when pub shares were shunned by investors in favour of more racy technology shares.
The table above also shows that other companies in the sector - Marston's, Mitchells & Butlers and EI Group - also have low rolling PEs. In addition to low growth prospects, these companies have high levels of debt which reduces PEs to reflect their increased riskiness to investors. The higher PEs in the sector attached to JD Wetherspoon, Fuller and Revolution Bars arguably reflect their higher quality, better growth prospects and in Revolution's case a takeover bid.
So are we any wiser as to whether Greene King is cheap or expensive?
Not really. Its current business performance and growth prospects suggests that its low PE ratio is not unreasonable. It is not the cheapest share in the sector and who's to say that the PE ratio could not fall?
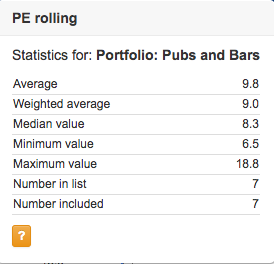
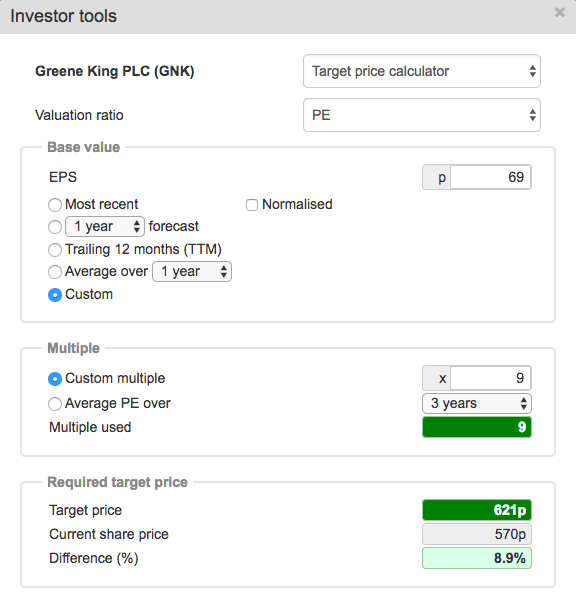
SharePad calculates a number of statistics for a portfolio or a sector. The average rolling PE weighted by market capitalisation is 9 times. We could use this to get a crude estimate of Greene King's valuation upside if it traded on a sector average multiple.
If we use SharePad's target price indicator using the current rolling EPS and sector average rolling PE it tells us that there is not much upside in the shares.
EBIT yield
PE ratios value the equity of a company which is the bit that belongs to shareholders. They ignore how a company is financed which can lead to some issues when using them (check out my article on The case for enterprise valuations to read more about this).
Enterprise values or EVs for short get round this problem. EVs value the whole business (enterprise) then take away liabilities such as debts, pension fund deficits and preferred equity to get a value of equity and a value per share.
A commonly used EV is the EBIT yield. This compares a company's trading profits (EBIT) with its enterprise value (the market capitalisation, plus net borrowings, plus pension fund deficit and preferred equity and minority interests). It tells you what pretax return a buyer of the whole business would be getting at the current share price.
The higher the EBIT yield, the cheaper a company is deemed to be. In today's stock market, a yield of over 10% would probably be considered to be cheap.
Let's see how Greene King stacks up on this measure.
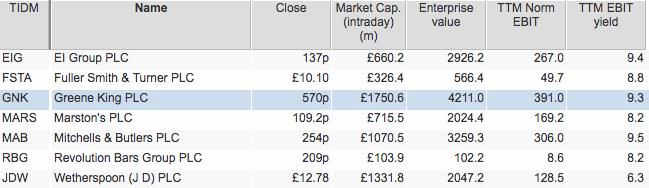
At 570p, it has an EBIT yield of 9.3% which is getting towards cheap but is consistent with a company which is struggling to grow.
What's interesting here is how EVs level the valuation playing field by adjusting for different levels of debt and pension deficits. Above, Fuller Smith & Turner had a rolling PE of 16.4 times compared with Greene King on 8.3 times which made it look very expensive in comparison. However, because Fuller has lower debts it actually has an EBIT yield which is not much lower than Greene King's.
Dividend yield
This expresses the company's dividend per share as a percentage of its share price. It measures the income yield from owning a share.
Income investors like high dividend yields but if they are too high they can be a warning sign for investors that the dividend may not be safe and could be cut. In today's markets, a yield of 6% or more is entering the danger zone and at the very least can be a sign that future dividend growth might be quite weak.
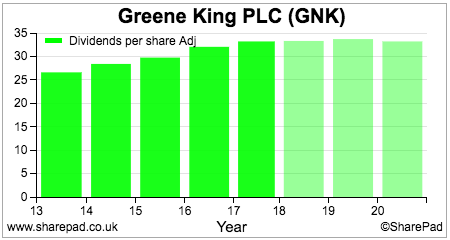
This is what seems to be happening at Greene King. Dividends have been increasing steadily in the recent past but future growth according to analyst forecasts is expected to be very weak.
Last year, shareholders received 33.2p per share in dividends. This gives the share a dividend yield of 5.8% at a share price of 570p. That looks quite tempting compared with the tiny interest rates currently being offered on savings accounts and government bonds but you have to ask yourself whether that is a sign that the shares are cheap.
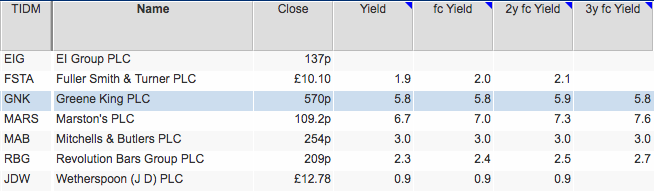
If you look at the table below, it is calculating the dividend yields you might be receiving at the current share price based on City analysts' dividend per share forecasts. Greene King's yield is not growing which is not a good sign. A high yield without much prospect of dividend growth can often be a very disappointing investment - especially if the dividend ends up being cut. Note the comment in the recent trading statement which mentioned 'sustainable' rather than growing dividends.
Shares with large dividends can be valued by estimating the future stream of dividends and discounting them to give a value per share in today's money (or a present value). You can do this quickly in Sharepad.
Dividend Discount Model (DDM)
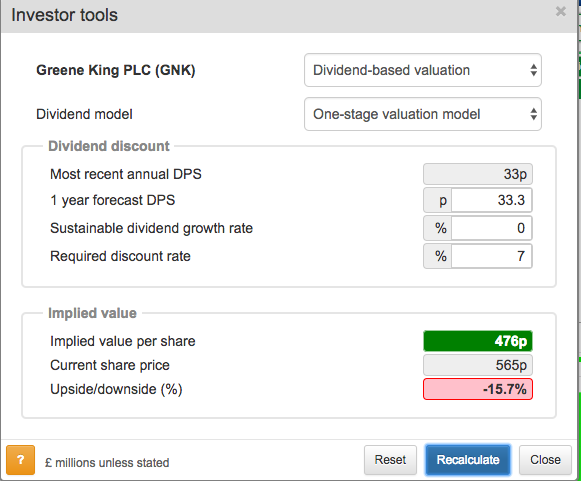
I am not going to get bogged down in the theory about how these valuations models work, but essentially if you are valuing a mature, slow growing business based on its expected future flow of dividends the valuation boils down to three key inputs.
- The forecast for the next annual dividend per share.
- The long-term sustainable growth rate in dividends.
- The return required by investors to invest in the shares (the discount rate). There is no right answer to what this number should be but bear in mind that shares are riskier than bonds and some shares are more riskier than others. My guess is that many professional investors would set a return of between 7% and 10% for a company such as Greene King.
Note: For this simple model to work, the growth rate must be less than the discount rate.
So if Greene King only maintains its dividend at just over 33p per share with investors wanting a 7% annual return to own the shares, the shares are only worth 476p at the moment.
However, if a growth rate of 2% can be achieved then the shares are undervalued.
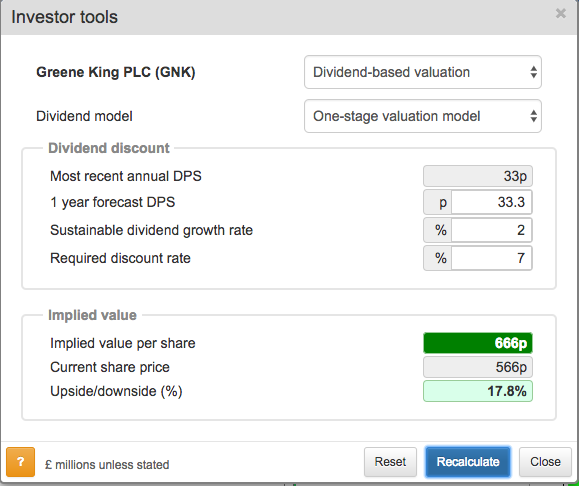
These valuations models can give widely different results depending on the combination of discount and growth rates used. However, they can be very useful for getting a feel for how much future dividend growth is factored into current share prices. For example, if you think that Greene King can improve its profitability and increase its dividend growth rate then this kind of analysis might be telling you that the shares could be undervalued.
Price to net asset value (P/NAV)
This is a useful valuation tool for companies with lots of assets. Many pub companies own the freehold properties they trade from which can give them similar characteristics to property companies. If you can buy a company for close to or below its net asset value (the value of its assets less total liabilities) then you may have come across a bargain.
For a pub company, it is best to focus on tangible net asset value which ignores intangible assets such as goodwill (the amount paid above NAV when buying another company).
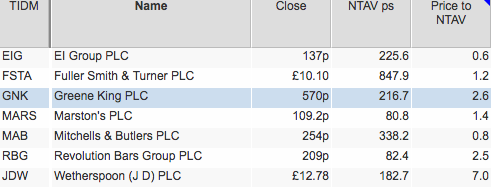
Greene King is not shouting 'bargain' but other companies such as Mitchells & Butlers or EI Group can be bought for less than their NTAV per share.
When you come across companies like this you have to ask yourself why the stock market is valuing the shares for less than the value of its net tangible assets. The shares could have been overlooked and represent genuine bargains but it could be that savvy investors don't believe that the value of the pubs on the balance sheet are realistic.
So how do you go about trying to work out if the asset values are realistic and not overstated. As an outsider you are never going to know for sure but there are a couple of checks you can do:
- Look at the ROCE of the business. A ROCE of less than 8% in the current interest rate environment might suggest that the company's assets can't make enough money to pay their way - they are overvalued.
- Check for losses on disposals of pubs. Losses occur when assets are sold for less than their NAV. Losses on disposals are a sign that asset values on those assets have been too high and this might be the case - but not necessarily so - for the ones remaining. One place to look is under 'Profit on disposals' in the Net cash from operations section of the cash flow statement. Losses on disposal will have been deducted from operating profit. However as they are an accounting loss rather than a cash loss they are added back to operating profit on the cash flow statement.
Mitchells and Butlers has a low ROCE which might make you think that its asset values need to be checked further.
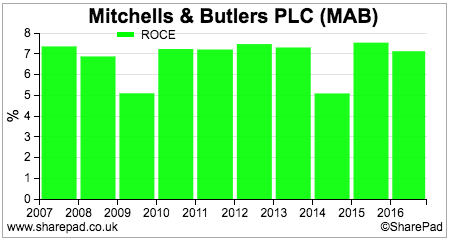
However, the company's recent trading statement highlighted that the pubs it had sold this year had been just above their NAV:
"During the year we have disposed of 79 sites which did not fit into our long-term estate plan, 73 of which were sold as a package which completed in July with the remainder sold individually. The proceeds from disposals total GBP46m which is marginally above the net book value of the properties"
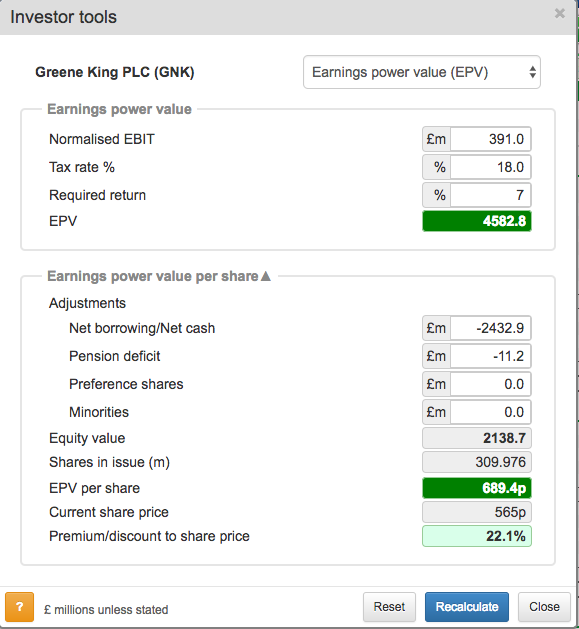
Earnings power value (EPV)
This is another enterprise-based valuation which gives you an estimate of how much a company's shares might be worth if its current trading profits stay the same forever. If you can buy a share with stable or growing profits for less than its EPV then you might have unearthed a bargain.
EPV is a more advanced valuation technique which I explain in a separate article here.
Greene King looks as if it might be undervalued on this basis but it will not be if trading profits start to fall or debt levels grow faster than profits.
City analysts are currently expecting Greene King to broadly maintain its trading profits (EBIT).
You should not expect to buy the shares of high quality, fast growing companies for less than their EPV. The stock market rightly prices in the expectation of growth into the shares.
However, EPV can still be very useful as it allows you to understand a share price better by estimating how much of it is explained by current profits and how much by future profits growth.
I do this by comparing the share price with the EPV per share. Generally speaking, if I am looking to invest in high quality growth business, I might look to pay no more than twice its EPV - a P/EPV of 2 or less - to stop me from paying too much. This means that up to half the company's share price is explained by the expectations of future growth.
You can see from the table below that there is a lot of pessimism baked into some pub company share prices at the moment. JD Wetherspoon and Fullers have the most optimism on this measure.
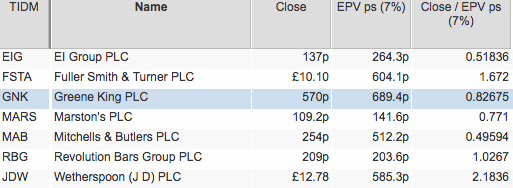
Revolution Bars is currently the subject of a 203p per share takeover bid. Could that bid be a little bit mean as it could be argued that the bidder is getting future profits growth for almost nothing?
Sum-of-the-parts (SOP)
This approach is used a lot by professional investors in order to get a more detailed and accurate valuation of a company. An EV is calculated for each separate business and various adjustments are made to get a value per share.
SOP is often referred to as a 'break up' valuation which estimates what a company would be worth if it was bought and its businesses were sold off separately.
These valuations can be quite involved and are best suited to someone who has some degree of industry knowledge. As with any absolute valuation it is only as good or credible as the assumptions behind it. A good SOP can take a lot of work.
| Asset (£m) | EBIT | Cost adj | Adj EBIT | Multiple | EV | Comment |
|---|---|---|---|---|---|---|
| Pub Company | 308.1 | -16.7 | 291.4 | 11.8 | 3,438.50 | RBG t/o |
| Pub Partners | 92.8 | -1.85 | 90.95 | 9.9 | 900.4 | Punch Taverns t/o |
| Brewing | 31 | -1.85 | 29.2 | 11 | 320.7 | Charles Wells t/o |
| Deferred tax asset | 63.1 | |||||
| Enterprise value | 4,722.70 | |||||
| less: | ||||||
| Net debt | -2,432.90 | |||||
| Pension deficit | -11.2 | |||||
| Equity value | 2,278.60 | |||||
| Shares (m) | 310 | |||||
| Value per share (p) | 735 |
The first thing I've done here is to adjust the most recent trading profits by allocating central costs of £20.4m to each division based on their proportion of turnover. I've then valued each division by applying an EV/EBIT multiple from a recent or ongoing takeover transaction in the appropriate sector to get an estimate of market value.
On this basis, I can value Greene King shares at 735p each and therefore raise the question whether its shares might be undervalued.
If you have found this article of interest, please feel free to share it with your friends and colleagues:
We welcome suggestions for future articles - please email me at analysis@sharescope.co.uk. You can also follow me on Twitter @PhilJOakley. If you'd like to know when a new article or chapter for the Step-by-Step Guide is published, send us your email address using the form at the top of the page. You don't need to be a subscriber.
This article is for educational purposes only. It is not a recommendation to buy or sell shares or other investments. Do your own research before buying or selling any investment or seek professional financial advice.