How to analyse and value water companies
This is not an article for novice investors, but if you like digging into numbers to try and find out what's going on in a company I hope you'll find this useful.
I am going to show you how to cut through the fog of water company finances so that you can check out the safety or otherwise of their dividends. I'll also show you a couple of tools that City analysts use to value water company shares. You can also apply this analysis to the UK electricity and gas networks of National Grid (LSE:NG.) and SSE (LSE:SSE).
Britain's water companies were privatised twenty five years ago. Since then many investors have bought their shares primarily for the chunky dividends that they tend to pay out. Water companies have also proven to be very popular with corporate buyers too. Of the ten big water companies that floated on the stock exchange a quarter of a century ago, only three of them remain.
So let's have a look at what's been going on with water company dividends.
Phil Oakley's debut book - out now!

Phil shares his investment approach in his new book How to Pick Quality Shares. If you've enjoyed his weekly articles, newsletters and Step-by-Step Guide to Stock Analysis, this book is for you.
Share this article with your friends and colleagues:
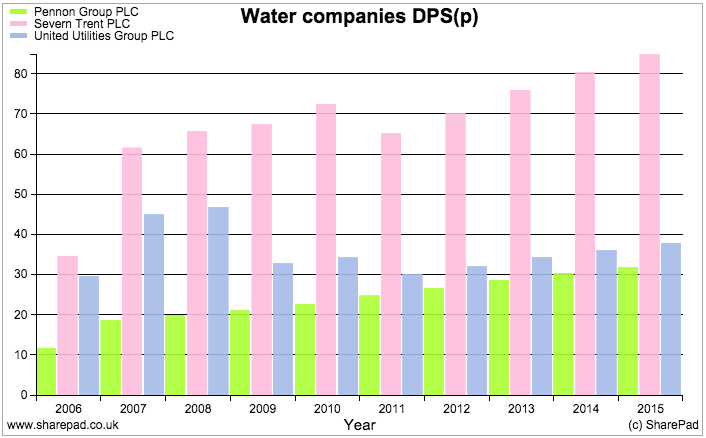
Water company dividends over the last ten years
At first glance, water companies seem one of the safest homes for your money on the stock exchange. After all, everybody needs and uses water regardless of what's going on with the economy. This means that the profits and cash flows of water companies should be relatively easy to predict. They should be relatively stable and are unlikely to bounce up and down a lot.
And in general they are. However, because water companies are local monopolies and face no competition the amount of money water companies can ultimately make is restricted by a regulator called OFWAT.
Every five years, OFWAT takes a good hard look at how good a job the water companies have been doing (known as a periodic review), how much money they have been spending and how profitable they have been. It then puts together a plan for the next five years.
It tells the water companies how much money they should be spending on maintaining all the pipes, sewers and reservoirs that they own and how much they can spend on expanding their networks. If OFWAT gets its sums right then customers should get a reliable source of clean water without their bills going up too much. In return, the water companies will be able to earn a reasonable profit on their assets. After spending money keeping those assets in good working order, they should have enough money left over to pay the interest on any borrowings, tax and those all important dividends to shareholders.
During the early years after privatisation, water companies were able to pay big dividends that kept increasing every year as they cut more costs than OFWAT expected them too. OFWAT eventually wised up to this and started setting very tough efficiency targets on spending and even cut customer bills. On top of this, as interest rates and the cost of borrowing money has come down in recent years, OFWAT has ruled that water companies don't need to be as profitable as they were in the past - they can get by with a lower return on their assets.
As a result, it has become harder and harder for water companies to keep on increasing their dividends.
If you look at the chart below you can see that the dividends paid by the three remaining water companies have been through a bit of a rocky patch during the last ten years. Both Severn Trent and United Utilities have had to cut their dividends whereas Pennon (which owns South West Water) has been able to keep on increasing its payouts. During the last OFWAT price setting period from 2010-15 all three companies were able to pay a rising annual dividend to their shareholders.
But on a close inspection of their profits and cash flows you could be forgiven for thinking how on earth have they been able to do this?
Below is a data table built in SharePad. Without doing any further research, the numbers in it could easily lead you to worry about the safety of water company dividends.
| Name | Close | fc DPS | fc Yield | fc Div cover | FCF ps | 10y avg FCF div cover | Capex to dep |
|---|---|---|---|---|---|---|---|
| Pennon Group PLC | 749.5p | 33.8 | 4.5 | 1.2 | -16.3 | -0.6 | 181.3 |
| Severn Trent PLC | £21.03 | 80.7 | 3.8 | 1.1 | 22.1 | 0.1 | 152.7 |
| United Utilities PLC | 872p | 38.5 | 4.4 | 1.1 | -2.7 | 0.2 | 206.8 |
Why do I say this?
Well for starters, the forecast dividends are barely covered by profits (in this case, earnings per share) as the forecast dividend cover ratios are barely more than 1.0. However, dividends are not paid from profits but from cash flow. The past history of water companies' cash flow makes for very grim reading.
During the last ten years, water companies have spent a lot more money on assets than the depreciation charge in their accounts. This has meant that there hasn't been much in the way of free cash flow produced - certainly nowhere near enough to fund the total dividends paid to shareholders.
So what's been going on? Have the water companies been pulling the wool over investors' eyes and been borrowing money to pay dividends? Or is there a clearer explanation?
The truth behind water companies' profits and cash flows
One of my favourite topics of investment analysis is trying to work out how much a company has to spend to stay in business and keep its existing assets in good working order (for more on this subject click here). This is known in professional investment circles as maintenance or "stay in business" capex and can be a lot different from a company's depreciation expense.
You need to get a feel for what this number is if you are to work out what a company's true profit really is. The bad news is that it is virtually impossible for a private investor to do this with any accuracy.
The good news for investors in water companies is that you can find out what this number is. Don't bother looking at a company's stock exchange news releases or annual report though - you are unlikely to find it there.
Water companies produce two sets of accounts. One for its investors and one for its regulator OFWAT. You need to ignore most of the numbers in the annual report and instead get your hands on a copy of a company's regulatory accounts or the annual report for the water company rather than the plc. You can do this by clicking on the following links:
- For United Utilities Water click here
- For Severn Trent Water click here
- For Pennon's South West Water click here
When you do, head for the back and the section labelled "Current cost accounts".
Current cost accounts
Stay with me on this one. You are about to learn why the numbers in current cost accounts are extremely useful.
Standard company accounts are based on something known as historic costs - what was actually paid or received at the time of a transaction. Some water company assets can last for more than thirty years which means that the depreciation charge in the accounts might be based on the cost of something thirty years ago. That asset will probably cost a lot more to replace today.
This is what current cost accounts do. They adjust costs for inflation so that the depreciation charge is a more realistic estimate of what a water company needs to spend to maintain its assets. In these accounts you will find two key numbers:
- Current cost depreciation
- Infrastructure renewals charge
Add these two numbers together and you have a true and accurate figure for stay in business capex. You can then work out a water company's real profits and cash flows. When it comes to working out the safety or otherwise of a company's dividend it is best to focus on cash flows.
How water companies have paid for their dividends
You can get all the numbers you need for this exercise from the current cost cash flow statement and SharePad or ShareScope. Put them into a spreadsheet as shown below and you can work out if the water companies have been paying their dividends from free cash flow - which is sustainable - or from borrowing money - which isn't.
| UU Water current cost cash flow (£m) | 2011 | 2012 | 2013 | 2014 | 2015 | Cumulative |
|---|---|---|---|---|---|---|
| Operating cash flow | 937.1 | 931.6 | 980.2 | 1115.7 | 1093.9 | 5058.5 |
| Less: | ||||||
| Net interest paid | -175.5 | -171.5 | -183.9 | -181.2 | -186.8 | -898.9 |
| Tax Paid | -67.8 | -11.7 | -83 | -2.9 | 4.9 | -160.5 |
| Capex | -572 | -700.4 | -758.3 | -874.9 | -855.2 | -3760.8 |
| Free cash flow | 121.8 | 48 | -45 | 56.7 | 56.8 | 238.3 |
| Add back Capex | 572 | 700.4 | 758.3 | 874.9 | 855.2 | 3760.8 |
| Less Maintenance expenditure | -527.9 | -523.9 | -570.8 | -572.5 | -591.5 | -2786.6 |
| Adj Free cash flow | 165.9 | 224.5 | 142.5 | 359.1 | 320.5 | 1212.5 |
| Dividend paid by water co to PLC | 259.1 | 338.5 | 218.3 | 148.2 | 175 | 1139.1 |
| Plc dividends paid to shareholders | 249.4 | 237.9 | 223.5 | 209 | 225.8 | 1145.6 |
| Free cash dividend cover | 0.49 | 0.2 | -0.2 | 0.27 | 0.25 | 0.21 |
| Adjusted free cash flow | 165.9 | 224.5 | 142.5 | 359.1 | 320.5 | 1212.5 |
| Plc dividends paid to shareholders | 249.4 | 237.9 | 223.5 | 209 | 225.8 | 1145.6 |
| Adj Free cash flow dividend cover | 0.67 | 0.94 | 0.64 | 1.72 | 1.42 | 1.06 |
Let me explain what's going on here.
In the top half of the table, you have a standard calculation of free cash flow where total capex is subtracted from operating cash flow. Below is a figure for maintenance expenditure (current cost depreciation plus the infrastructure renewals charge). To calculate adjusted free cash flow, we add back total capex to our standard free cash flow and take away stay in business capex.
You can also see the dividends paid by the water company back to the parent company (the plc) and the dividends paid by the parent company to shareholders. The other things to bear in mind is that the company's cash flows over a five year period can be quite lumpy so focus on the cumulative figures instead.
If we look at United Utilities on the basis of standard free cash flow and compare it with the cash dividend paid to shareholders then it seems there is a problem. It only produced £238m of free cash flow over five years but paid out just over £1.1bn in dividends to shareholders - a free cash flow dividend cover of just 0.21.
However, if we look at adjusted free cash flow then it virtually matches - it is slightly more than - the amount of money paid out in dividends. In other words the dividends paid have been perfectly affordable. The company has then borrowed money to expand its asset base (the portion of capex greater than maintenance capex).
The same story is true for Severn Trent and Pennon as shown in the tables below:
| SVT Water current cost cash flow (£m) | 2011 | 2012 | 2013 | 2014 | 2015 | Cumulative |
|---|---|---|---|---|---|---|
| Operating cash flow | 827.1 | 867.1 | 904.4 | 903.2 | 891.5 | 4393.3 |
| Less: | ||||||
| Net interest paid | -172 | -289.1 | -228.6 | -195.4 | -119.6 | -1004.7 |
| Tax Paid | -58.3 | -67.8 | -53.5 | -12.2 | -24.9 | -216.7 |
| Capex | -461.9 | -649.5 | -539.1 | -581.5 | -528.9 | -2760.9 |
| Free cash flow | 134.9 | -139.3 | 83.2 | 114.1 | 218.1 | 411 |
| Add back Capex | 461.9 | 649.5 | 539.1 | 581.5 | 528.9 | 2760.9 |
| Less Maintenance expenditure | -392 | -428.2 | -448.1 | -453.9 | -456.1 | -2178.3 |
| Adj Free cash flow | 204.8 | 82 | 174.2 | 241.7 | 290.9 | 993.6 |
| Dividend paid by water co to PLC | 153.6 | 266 | 72 | 332.1 | 196.8 | 1020.5 |
| Plc dividends paid to shareholders | 169.4 | 159 | 322 | 159 | 169.4 | 978.8 |
| Free cash dividend cover | 0.8 | -0.88 | 0.26 | 0.72 | 1.29 | 0.42 |
| Adjusted free cash flow | 204.8 | 82 | 174.2 | 241.7 | 290.9 | 993.6 |
| Plc dividends paid to shareholders | 169.4 | 159 | 322 | 159 | 169.4 | 978.8 |
| Adj Free cash flow dividend cover | 1.21 | 0.52 | 0.54 | 1.52 | 1.72 | 1.02 |
| SWW current cost cash flow(£m) | 2011 | 2012 | 2013 | 2014 | 2015 | Cumulative |
|---|---|---|---|---|---|---|
| Operating cash flow | 273.6 | 278.3 | 325.1 | 327.5 | 326.4 | 1530.9 |
| Less: | ||||||
| Net interest paid | -52.9 | -53.9 | -61.5 | -58.8 | -52.9 | -280 |
| Tax Paid | -30.4 | -28.3 | -33.6 | -44.1 | -36.4 | -172.8 |
| Capex | -121.6 | -145.7 | -124.3 | -155.8 | -152.9 | -700.3 |
| Free cash flow | 68.7 | 50.4 | 105.7 | 68.8 | 84.2 | 377.8 |
| Add back Capex | 121.6 | 145.7 | 124.3 | 155.8 | 152.9 | 700.3 |
| Less Maintenance expenditure | -131 | -136.2 | -143 | -153.9 | -158.5 | -722.6 |
| Adj Free cash flow | 59.3 | 59.9 | 87 | 70.7 | 78.6 | 355.5 |
| Dividend paid by water co to PLC | 58.4 | 77.9 | 133 | 112 | 255.8 | 637.1 |
| Plc dividends paid to shareholders | 56.8 | 69.1 | 77.9 | 69.4 | 69 | 342.2 |
| Free cash dividend cover | 1.21 | 0.73 | 1.36 | 0.99 | 1.22 | 1.1 |
| Adjusted free cash flow | 59.3 | 59.9 | 87 | 70.7 | 78.6 | 355.5 |
| Plc dividends paid to shareholders | 56.8 | 69.1 | 77.9 | 69.4 | 69 | 342.2 |
| Adj Free cash flow dividend cover | 1.04 | 0.87 | 1.12 | 1.02 | 1.14 | 1.04 |
Why this matters
The water companies have had detailed spending plans for the period 2015-20 given to them by OFWAT. This means that they have a very good idea how much money will be coming into the business and how much will be going out. This in turn means they also have a good idea of how much free cash flow there will be and the size of dividends they can pay. This has allowed them to make the following statements about future dividends a few months ago:
Pennon:
"The Board was pleased to announce in March the continuation of the current dividend policy, targeting 4% year-on-year growth above RPI inflation to 2020."
Severn Trent:
"2015/16 dividend 80.66 pence, followed by annual growth of no less than RPI until 2020."
United Utilities:
"dividend growth rate target of at least RPI inflation each year through to 2020"
Valuing water company shares with dividends
As free cash flow and dividends are likely to be very similar you can attempt to value water shares using a dividend discount model (DDM). This is based on using an interest rate to discount the value of future dividends back to a present value today (for more on this subject click here).
Here are some estimated values for each water company. Inflation is currently 1% but we will assume a long-term average rate of 2%. We also use an interest rate (also called discount rate, discount factor or DF) of 7% to reduce estimates of future dividends to a value today.
Remember the lower the interest rate and the higher the growth rate of dividends assumed, the higher the value of the share will be. Water companies are seen to be quite low risk investments hence the choice of a relatively low interest rate of 7%.
For the period to 2020, dividends are assumed to grow in line with the company's statements above and then grow by the rate of inflation forever which is assumed to be 2%.
| United Utilities | Dps(p) | Growth | DF @ 7% | PV |
|---|---|---|---|---|
| 2015 | 37.7 | |||
| 2016 | 38.5 | 2% | 0.9346 | 35.94 |
| 2017 | 39.2 | 2% | 0.8734 | 34.26 |
| 2018 | 40 | 2% | 0.8163 | 32.66 |
| 2019 | 40.8 | 2% | 0.7629 | 31.13 |
| 2020 | 41.6 | 2% | 0.713 | 29.68 |
| 2021 | 42.5 | 2% | 0.6663 | 28.29 |
| After 2021 (Terminal value) | 866.1 | 0.6663 | 577.12 | |
| Estimated value per share(p) | 769.08 |
| Severn Trent | Dps(p) | Growth | DF @ 7% | PV |
|---|---|---|---|---|
| 2015 | 80.66 | |||
| 2016 | 82.3 | 2% | 0.9346 | 76.89 |
| 2017 | 83.9 | 2% | 0.8734 | 73.3 |
| 2018 | 85.6 | 2% | 0.8163 | 69.87 |
| 2019 | 87.3 | 2% | 0.7629 | 66.61 |
| 2020 | 89.1 | 2% | 0.713 | 63.5 |
| 2021 | 90.8 | 2% | 0.6663 | 60.53 |
| After 2021 (Terminal value) | 1853.1 | 0.6663 | 1234.77 | |
| Estimated value per share(p) | 1645.46 |
| Pennon | Dps(p) | Growth | DF @ 7% | PV |
|---|---|---|---|---|
| 2015 | 31.7 | |||
| 2016 | 33.6 | 6% | 0.9346 | 31.4 |
| 2017 | 35.6 | 6% | 0.8734 | 31.11 |
| 2018 | 37.8 | 6% | 0.8163 | 30.82 |
| 2019 | 40 | 6% | 0.7629 | 30.53 |
| 2020 | 42.4 | 6% | 0.713 | 30.25 |
| 2021 | 43.3 | 2% | 0.6663 | 28.83 |
| After 2021 (Terminal value) | 882.7 | 0.6663 | 588.19 | |
| Estimated value per share(p) | 771.13 |
These dividend valuation models suggest that United Utilities and Severn Trent shares might be expensive compared with their current share prices. Pennon shares might be slightly cheap. However, the valuations will change significantly depending on your choice of interest rate and estimates of dividend growth rate and future inflation. There's also the role of the regulator to consider. The next review of prices might be more generous or more strict and dividend growth could be higher or lower than inflation after 2020.
These kind of models are useful in that they can give you an idea as to what rates of future dividend growth might be implied by current share prices.
Enterprise value (EV) to regulatory capital value (RCV) multiples
Another useful number in the regulatory accounts is something known as the regulatory capital value (RCV). This is the total value of the water company's assets and is used by the regulator to set a company's allowed profits. RCV is sometimes referred to as regulatory asset value (RAV) or regulatory asset base (RAB).
RCV is also seen by City analysts as an estimate of the market value of the water company. To see if a water company's shares are cheap or expensive the company's enterprise value (the market value of shares plus net debt) is often compared with its RCV.
Here are some rough rules of thumb for using this method:
- EV should be more than RCV if a company can make more money than the regulator has assumed - known as a premium.
- EV should be less than RCV if the company will make less money than the regulator has assumed- known as a discount.
A premium should be biggest at the start of a price review period to reflect the size of any extra profits expected to be made. As the next price review approaches (in 2020) the premium should be very small and could even move to a discount as the regulator shares any gains made with customers by lowering prices in the future.
Some water companies have been taken over for as much as 40% more than their RCV in the past. These takeover prices have been explained by the buyer being able to stuff the company with lots of cheap debt and therefore make more money than the regulator had assumed. Most experts don't expect this kind of generous takeover to happen again anytime soon although Severn Trent has been the subject of takeover rumours recently.
| Company | EV(£m) | less EV of non water (£m) | EV of Water(£m) | RCV(£m) | EV/RCV | Premium |
|---|---|---|---|---|---|---|
| Pennon | 5542 | 1500* | 4042 | 2952 | 1.37 | 37% |
| United Utilities | 12306 | 0 | 12306 | 10027 | 1.23 | 23% |
| Severn Trent | 9713 | 0 | 9713 | 7740 | 1.25 | 25% |
*Estimate of value for Pennon's Viridor waste business
Based on this quick analysis, water company shares are priced at a healthy premium to their RCV's. Smart investors would ideally look to buy water company shares at a much lower premium or ideally a discount.
The analysis of water companies is quite involved but hopefully you can see that a bit of extra effort helps you to learn a lot more.
If you have found this article of interest, please feel free to share it with your friends and colleagues:
We welcome suggestions for future articles - please email me at analysis@sharescope.co.uk. You can also follow me on Twitter @PhilJOakley. If you'd like to know when a new article or chapter for the Step-by-Step Guide is published, send us your email address using the form at the top of the page. You don't need to be a subscriber.
This article is for educational purposes only. It is not a recommendation to buy or sell shares or other investments. Do your own research before buying or selling any investment or seek professional financial advice.