Stock Watch: Restaurant Group
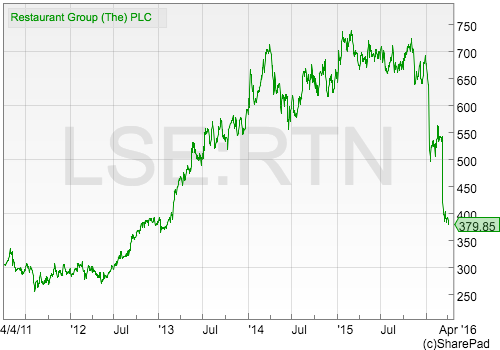
Restaurant Group (LSE:RTN) used to be a firm favourite with investors. This is no longer the case. Since the start of 2016 its share price has collapsed and the punchy stock market valuation it used to command has disappeared.
The owner of restaurant brands such as Frankie and Benny's, Chiquito and Coast to Coast has hit a sticky patch. A downbeat trading statement in January was followed by an equally cautious outlook in its 2015 results statement in March. In short, investors are now questioning whether Restaurant Group can grow its profits in the future.
Are the good days over for Restaurant Group or can it get back on track? I'm going to use SharePad to see how good a business Restaurant Group has been in the past and what its future prospects might be.
Phil Oakley's debut book - out now!

Phil shares his investment approach in his new book How to Pick Quality Shares. If you've enjoyed his weekly articles, newsletters and Step-by-Step Guide to Stock Analysis, this book is for you.
Share this article with your friends and colleagues:
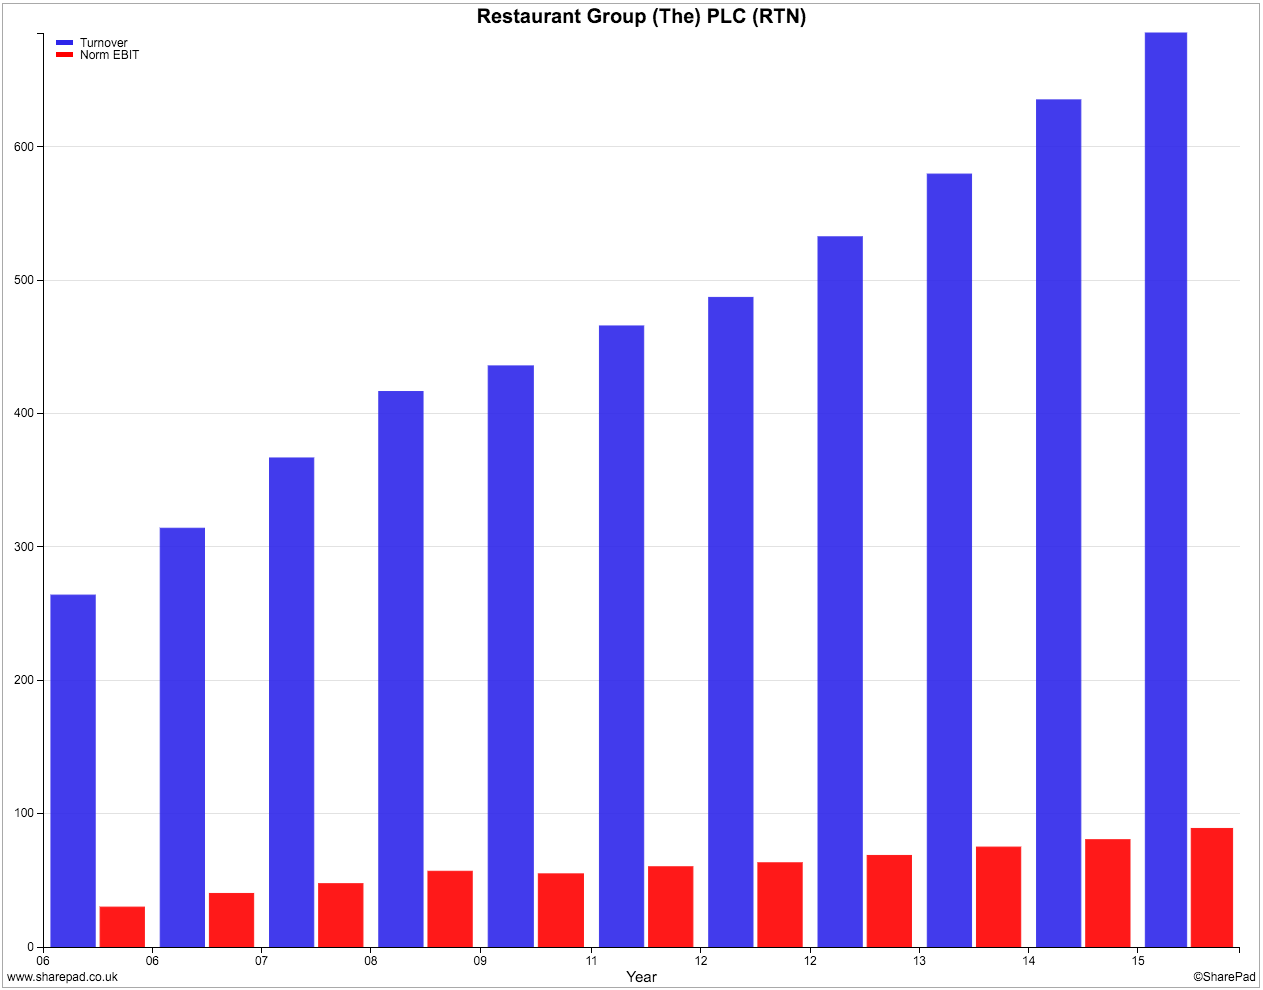
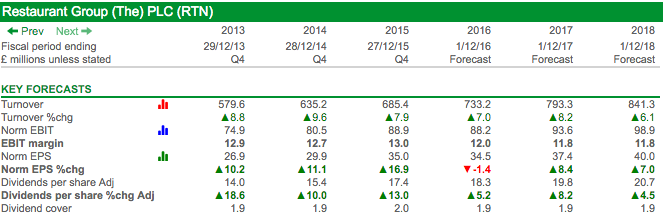
Sales and profits track record
As you can see, Restaurant Group has had a good track record of growing its sales and profits. Both have more than doubled during the last decade. This has been driven by opening lots of new restaurants and selling more from them once they have opened (known as like-for-like sales). More on this later.
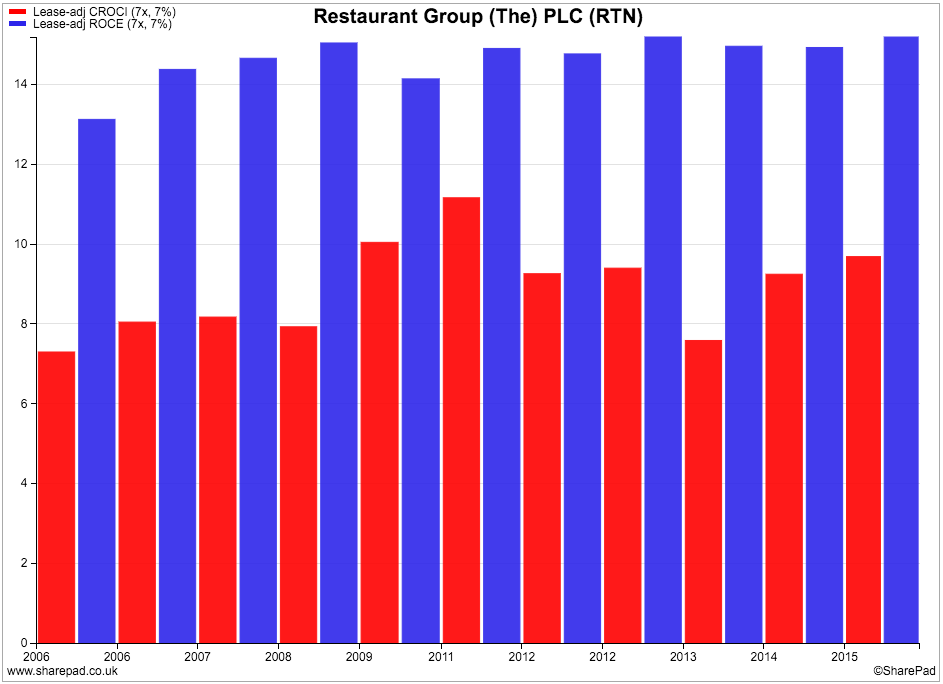
Returns on investment
Restaurant Group tends to rent the properties it uses for its restaurants (although it does buy some) so any view of how good it is at getting a good bang for its buck needs to take this into account. That's why the key return on capital employed (ROCE) and cash flow return on capital invested (CROCI) ratios should include a capitalised value of the rented properties and the hidden, off-balance sheet debt that they represent.
As usual, I have multiplied the company's annual rental expense by seven to get an estimate of the hidden debt and have used a 7% interest rate to add back to profits. (For more on this important topic see How to analyse companies with hidden debt)
As you can see, Restaurant Group's ROCE (the blue or second bar) has been very respectable, and consistent, and was over 15% in 2015. Despite heavy investment in new restaurants its CROCI has not been too bad either although it is consistently short of the benchmark of 10% which I see as the hallmark of a quality business.
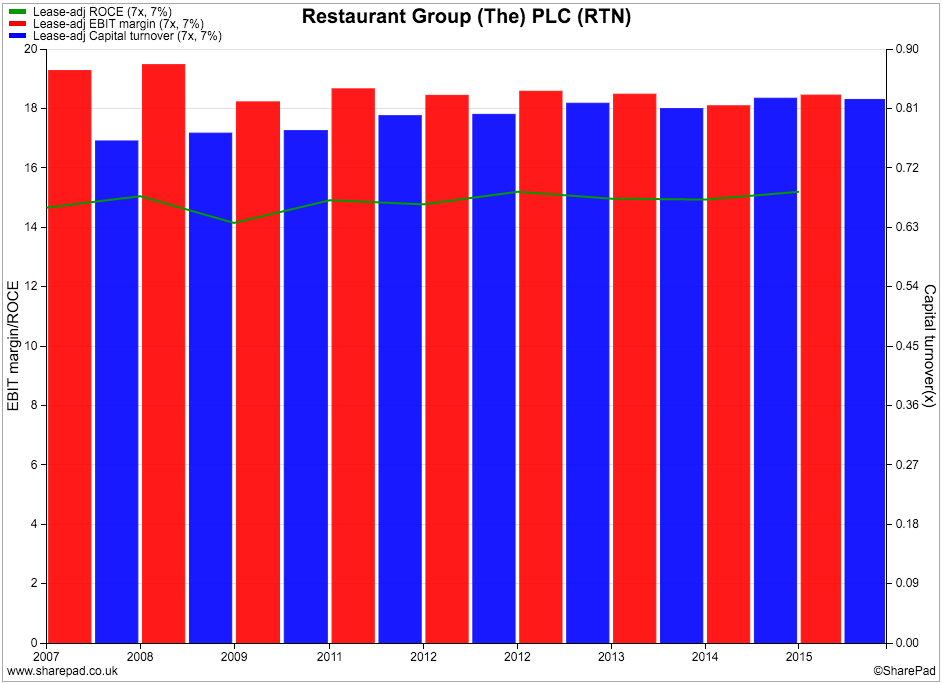
The company's ROCE has been achieved by having fairly stable lease-adjusted profit margins of around 18% but capital turnover (the second or blue bar) has been improving slightly which is a always good sign, especially as it has been investing heavily in recent years. Capital turnover is the revenue generated per £1 invested.
Free cash flow performance
The good news for investors is that Restaurant Group has been able to produce reasonable amounts of free cash flow year in, year out. It has also been increasing during the last couple of years.
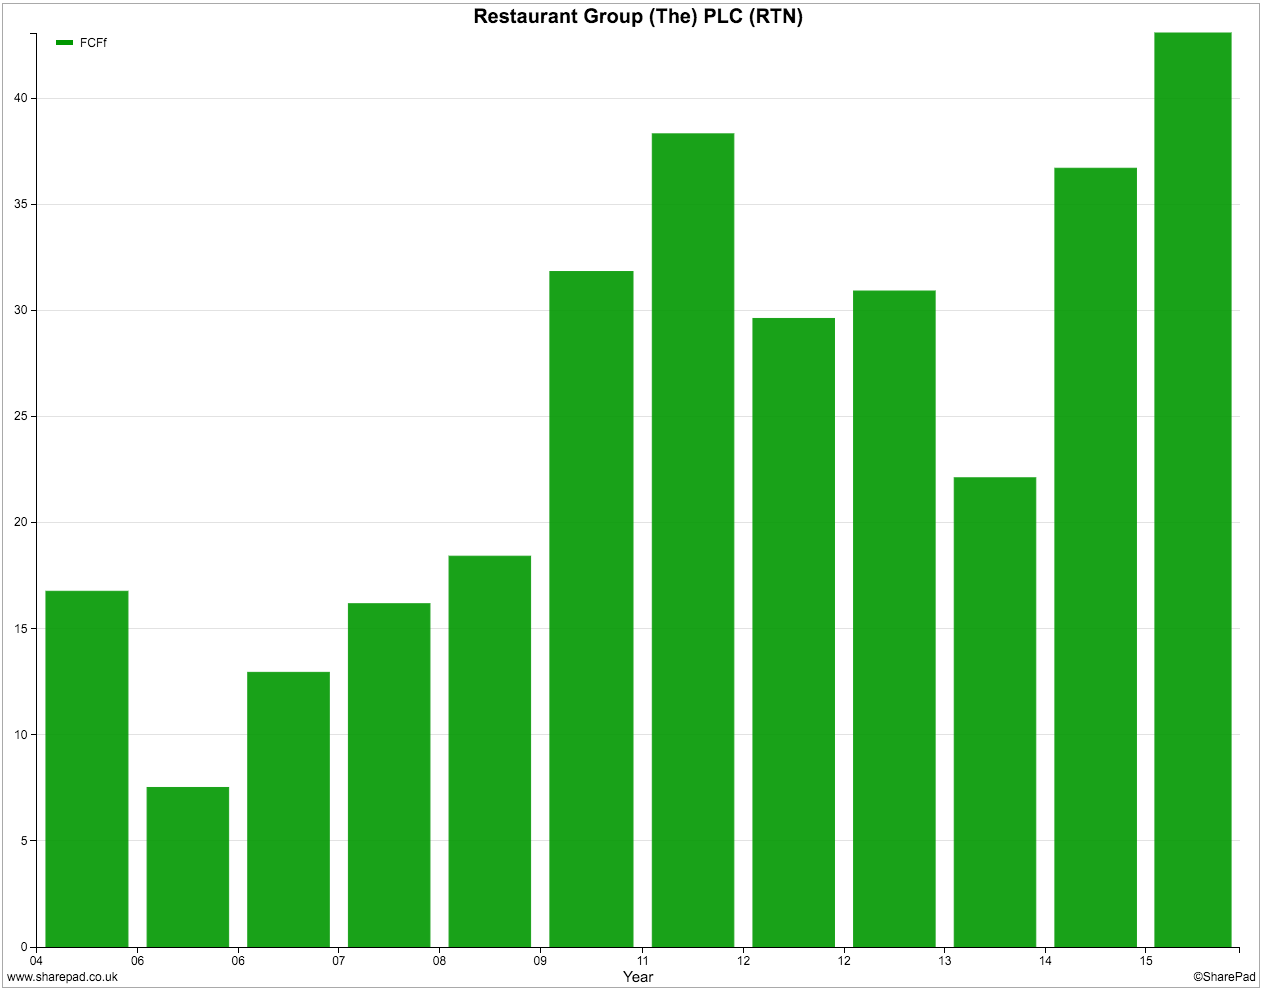
It would be worrying if this business was not producing free cash flow. This is because it is renting properties when it opens up new restaurants rather than buying more expensive freehold properties. If it was doing that then giving the rate it is opening new restaurants, my guess would be that the company might not be generating any free cash at all and might even have negative free cash flow.
This characteristic is true of many high street retailers. What you need to bear in mind when you come across companies like this which are expanding is that the annual rent bill will be increasing and with it the amount of hidden, off-balance sheet debt.
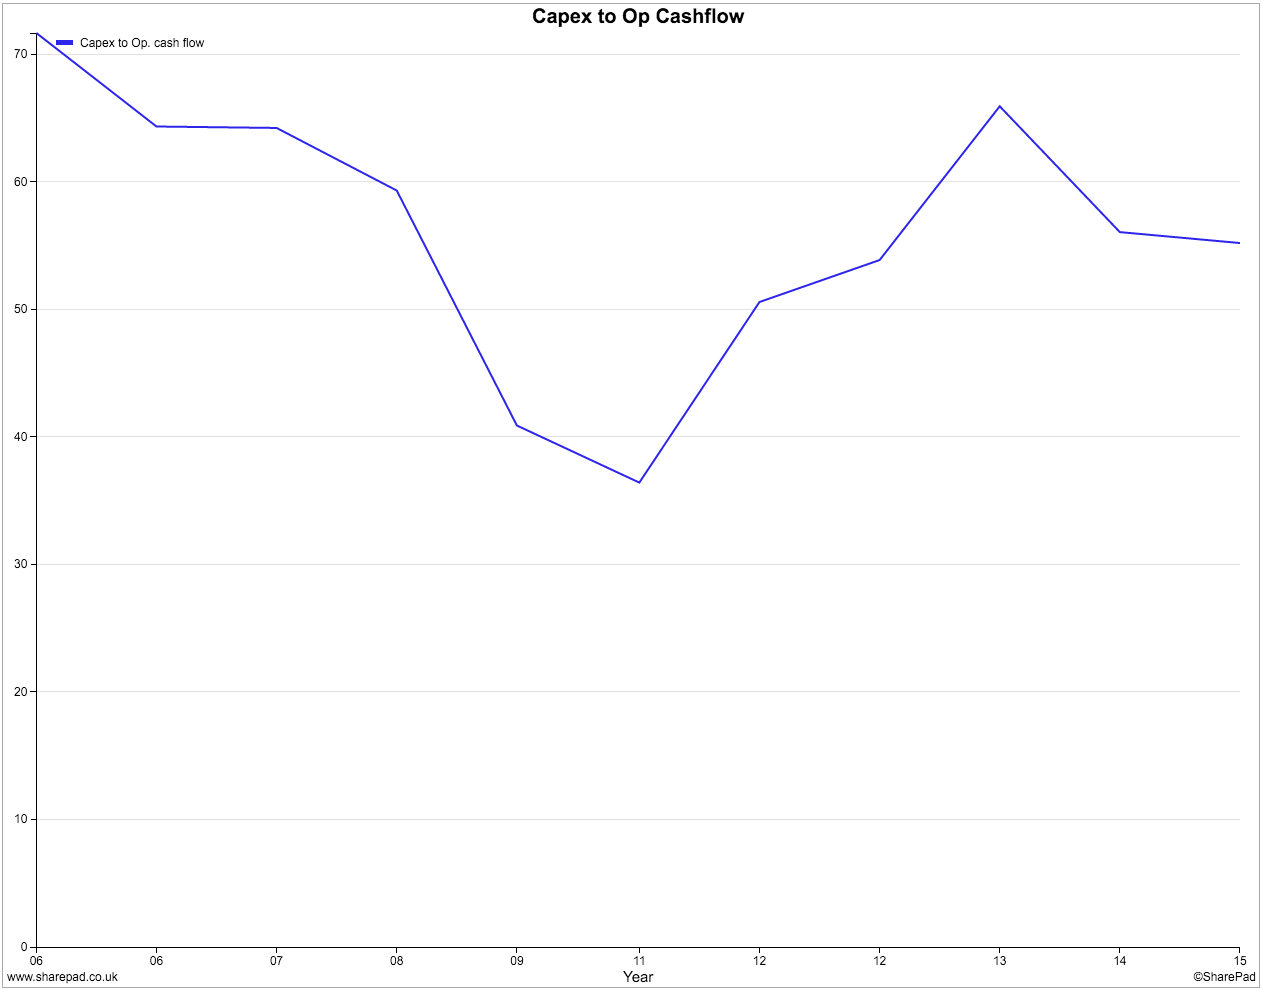
As you can see in the charts below, the company has been investing heavily. Capex (spending on new restaurant assets) as a percentage of operating cash flow has been pretty high.
The black line in the chart below looks at the ratio of capex to depreciation. A ratio of over 100% is usually a sign that a company is expanding its asset base (provided that depreciation is an accurate reflection of the money needed to maintain existing assets - it isn't always).
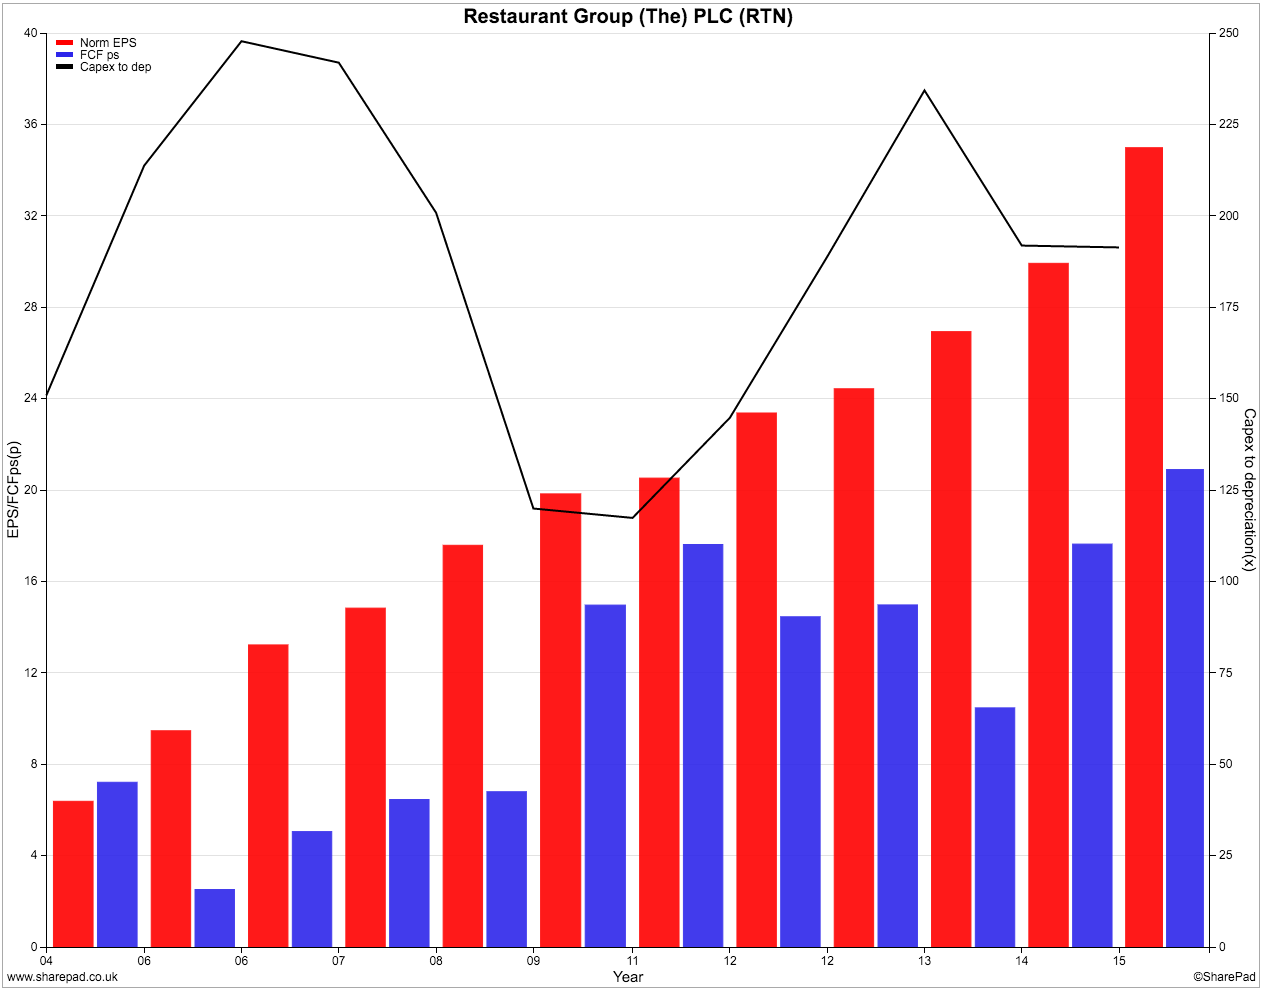
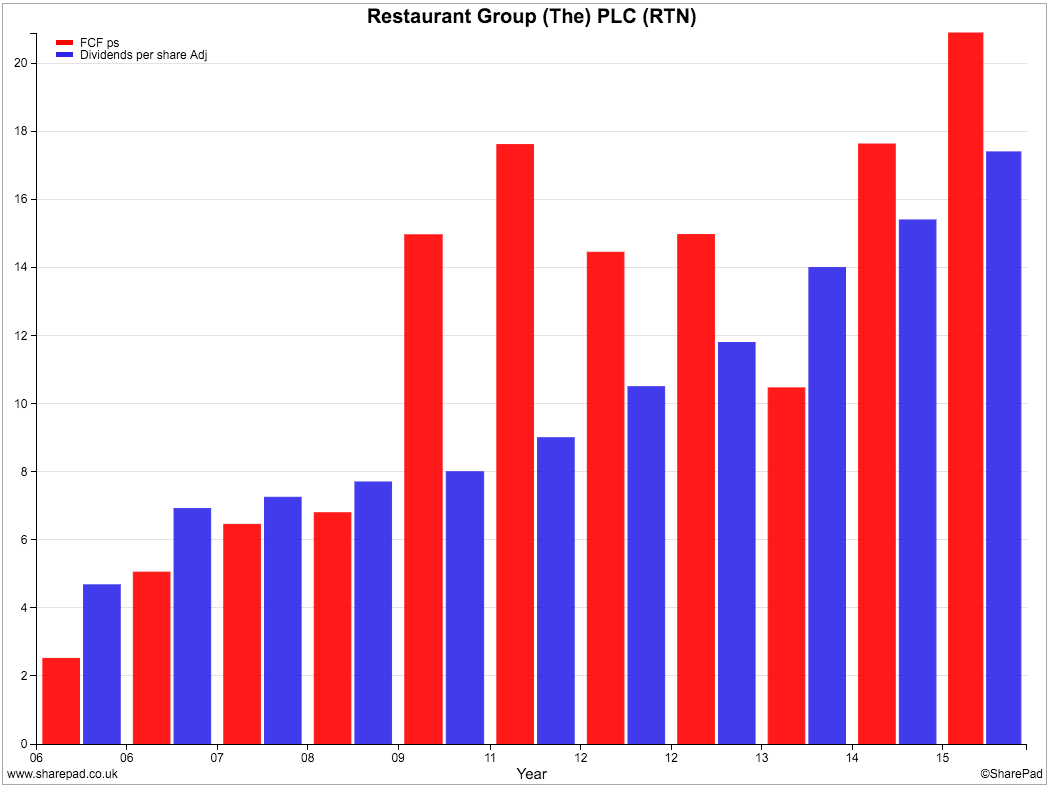
You can clearly see that Restaurant Group's investment levels have been much higher than depreciation as it has continued to open new restaurants. This has seen free cash flow per share (the second or blue bar) lag earnings per share (the first or red bar) by a significant margin. I don't see this as anything to worry about as looking at the trends in ROCE above tells us that all the extra money spent has been producing good returns for investors.
The cash generation of the business has been able to fund a growing dividend payout to shareholders. The chart below shows that the rate of dividend growth has been quite impressive in recent years.
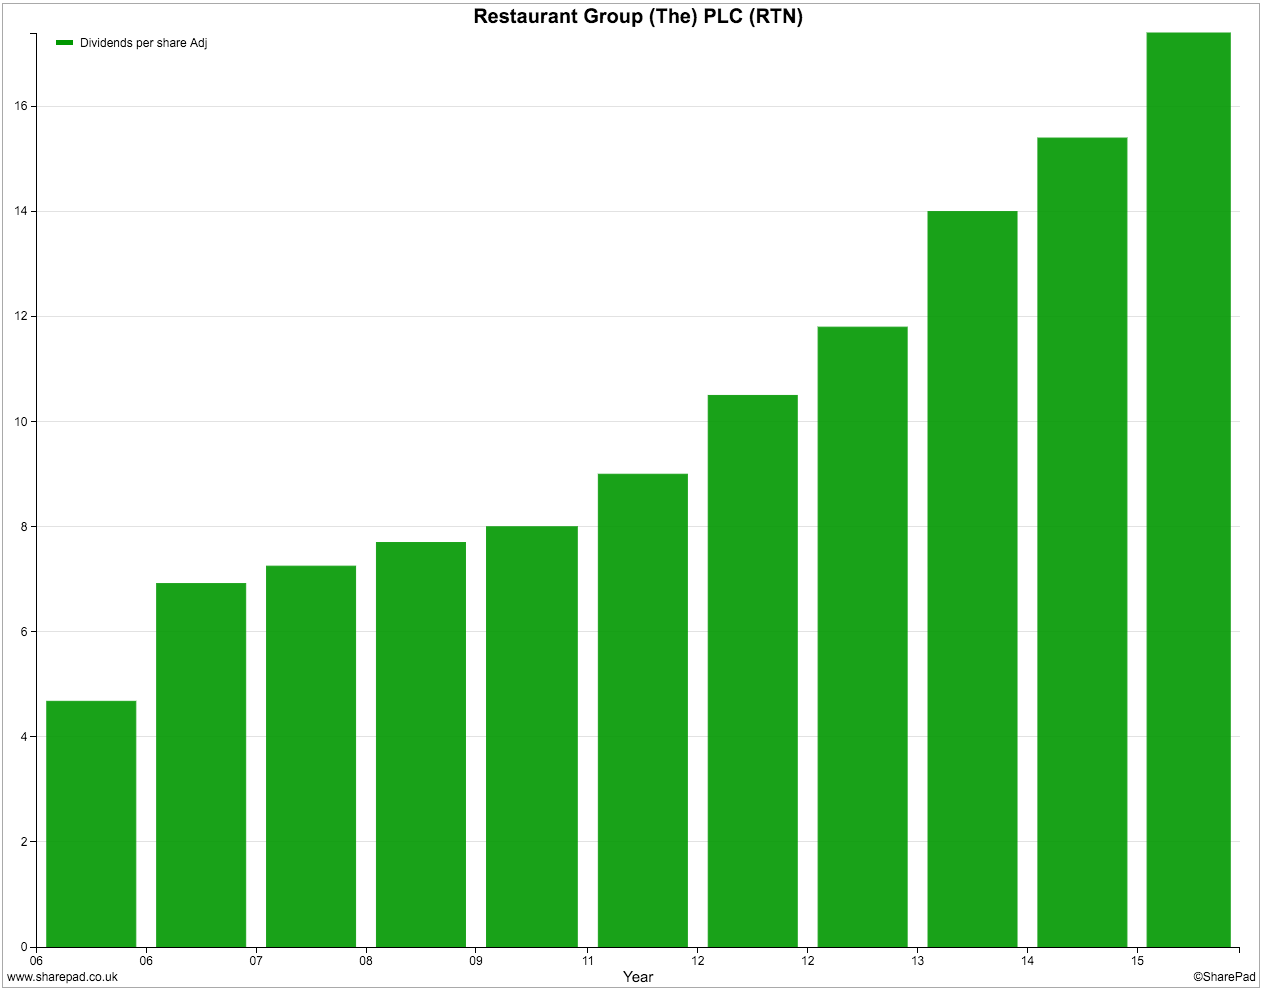
More important is that the dividend has been comfortably funded out of free cash flow as the chart below shows.
So Restaurant Group's free cash flow performance looks reasonable given the amount it has been investing. However, when reading through some of its past annual results* in SharePad I came across some interesting information.
Have a look at the table below:
| Year | MCapex | Depreciation | Sales | MCapex to Depreciation | MCapex to Sales |
|---|---|---|---|---|---|
| 2015 | 19.7 | 39.1 | 685.4 | 50.38% | 2.87% |
| 2014 | 20 | 36.5 | 635.2 | 54.79% | 3.15% |
| 2013 | 20.9 | 32.9 | 579.6 | 63.53% | 3.61% |
| 2012 | 15.8 | 29.1 | 532.5 | 54.30% | 2.97% |
| 2011 | 14.4 | 28.5 | 487.1 | 50.53% | 2.96% |
| 2010 | 11.3 | 26.8 | 465.7 | 42.16% | 2.43% |
| 2009 | 11.4 | 26.3 | 435.7 | 43.35% | 2.62% |
| 2008 | 10.8 | 23.3 | 416.5 | 46.35% | 2.59% |
Restaurant Group very helpfully tells investors how much money it spends on maintaining and refurbishing its existing restaurants - its maintenance or stay-in-business capex. In 2015 it said that the amount it spent was £19.7m compared with a depreciation and amortisation expense of £39.1m.
As you can see, its maintenance capex has been around 50% of depreciation and 2.5%-3% of sales since 2008. This raises two interesting possibilities. The company could be skimping on keeping its existing restaurants looking nice for customers by under-investing and not replacing worn out assets. Or its depreciation expense is very conservative and its true cash profits (or owner earnings as Warren Buffett calls them) are higher than its reported net profits and EPS.
If the company was under-investing then you would expect to see this reflected in its sales performance as customers decided to eat in nicer surroundings at rival restaurants. This doesn't seem to have been the case.
So if its maintenance capex is adequate to keep existing restaurants in reasonable conditions its owner earnings would be:
Net income (£68.9m) + Depreciation (£39.1m) - maintenance capex (£19.7m) = £88.3m
In other words, owner earnings might be 28% higher than reported earnings. Take this in the context of the current 366p share price at the time of writing and Restaurant Group's market capitalisation of £735.6m. This gives is a trailing PE ratio of 10.7 times on reported profits (735.6/68.9) or 8.3 times based on the owner earnings above (735.6/88.3).
I don't know whether my owner earnings estimate is right but if I was looking at investing in Restaurant Group this is where I would be spending a lot of my research time.
* By the way, the extensive news archive is one of the many really useful features of SharePad. You can go back and read past years of annual results without having to go elsewhere. With Restaurant Group I was able to read its 2005 annual results statement which saved me loads of time surfing the internet or downloading annual reports.
Financial Strength
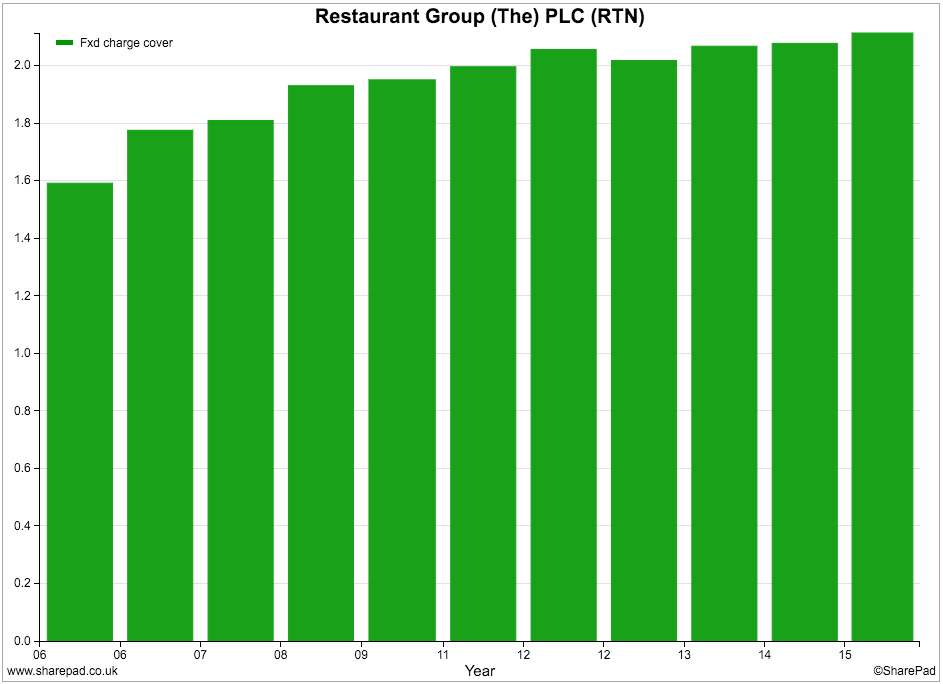
The company's finances look to be in good shape. Fixed charge cover - which looks at how comfortably profits can pay the interest on borrowings and rents - is comfortably over 2.0 times and shows that there is nothing too much to worry about at the moment.
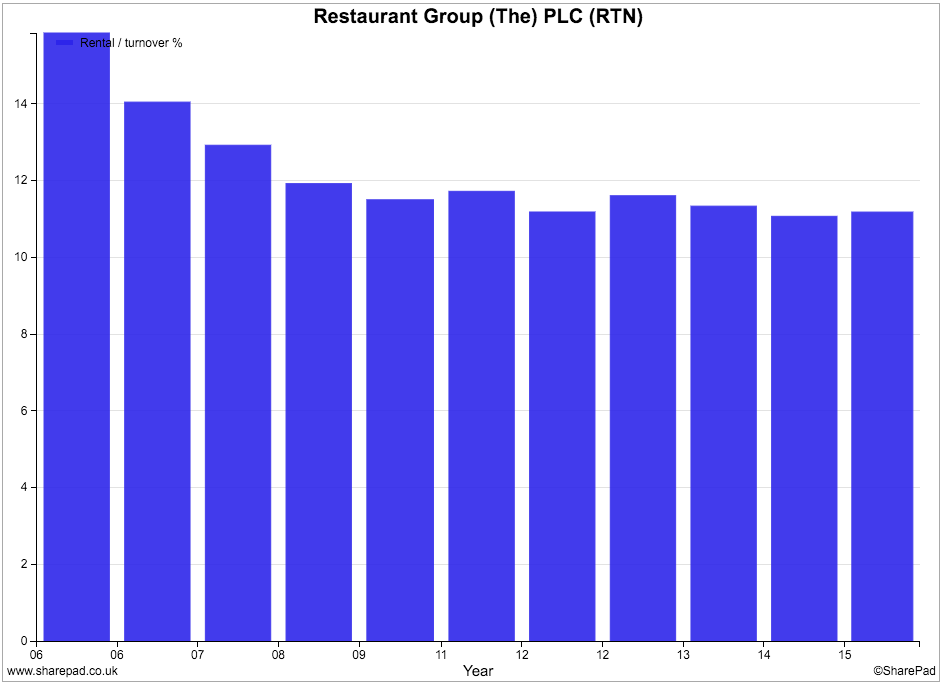
Rental expenses as a percentage of turnover have also been coming down. At 11.2% of turnover it is still a big fixed cost but it was nearly 16% a decade ago. Put simply, Restaurant Group needs to make less sales to pay its rent bill than it used to and that is a good thing.
Borrowing levels have been coming down. The amount of on-balance sheet borrowings is low.
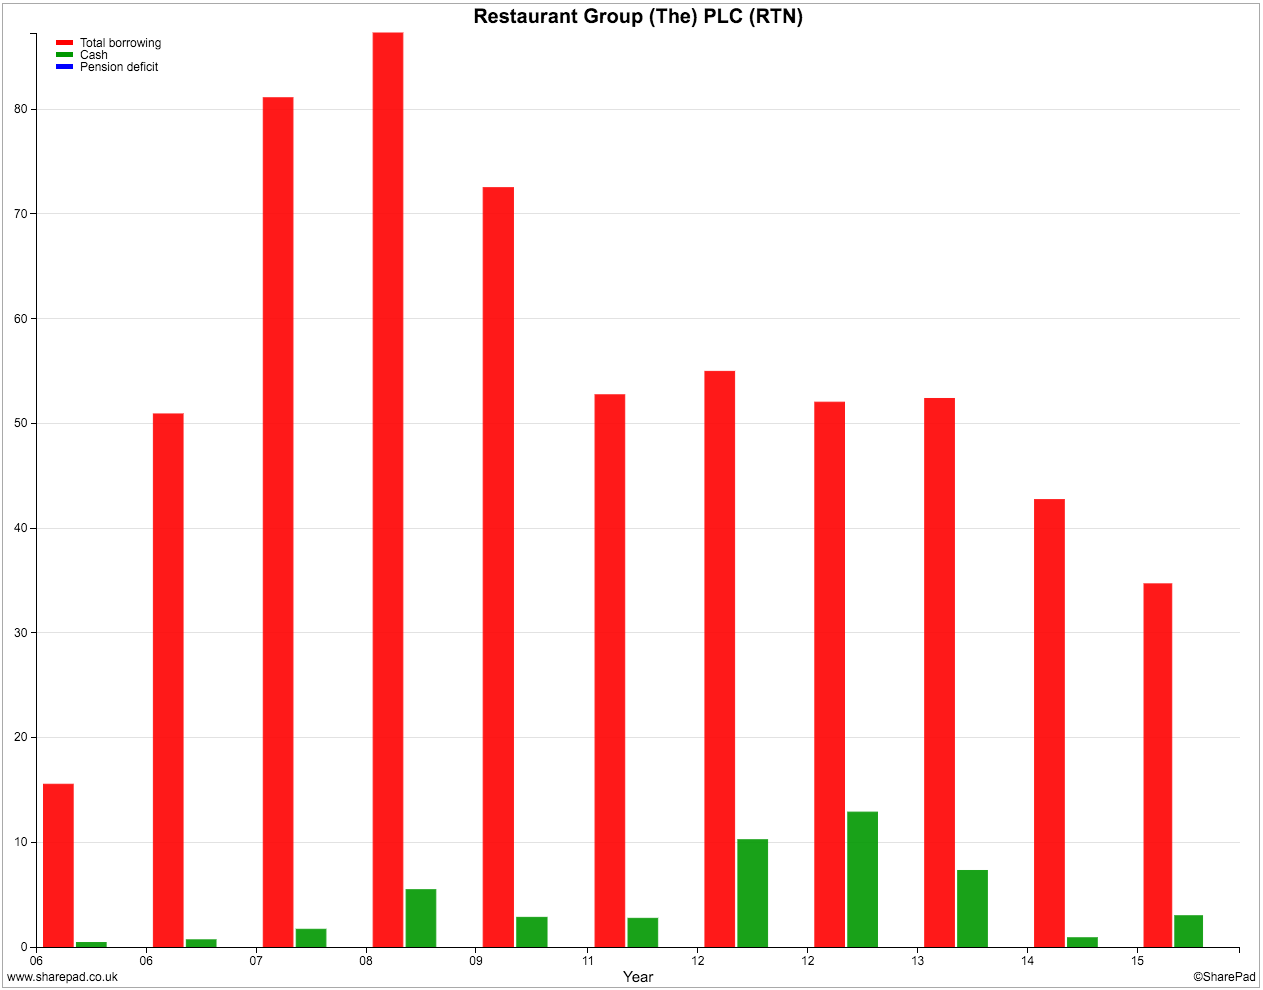
However, the amount of off-balance sheet borrowing - or hidden debt - has been going up as the number of rented restaurants has increased. Applying a seven times multiplier to the current rent bill of £76.6m gives an estimate of hidden debt of £537m.
Valuation and future prospects

This time last year, Restaurant Group shares were changing hands for more than 20 times earnings. Now they are trading at half that. Throw in a forecast dividend yield of 5% and an EBIT yield of 9.6% and it's not difficult to argue that the shares look reasonably cheap. Even more so if you believe that its reported profits are less than its true profits.
There are rarely any free lunches on the stock market which is why shares often look cheap when they are not. When it comes to Restaurant Group there are some big concerns about its ability to keep growing its profits.
City analysts are expecting no growth in profits in 2016. A rebound is expected in 2017 but I'd treat those forecasts with a lot of caution as the company's prospects seem very uncertain at the moment.
Some people are worried that Restaurant Group's growth potential may be running out of steam. With retailers or restaurants which tend to grow by increasing the number of outlets it's often quite difficult for an outside investor to work out what's going on.
Let me explain.
Restaurants and retail stores take time to mature and reach their potential sales and profits. The sales performance of new stores is not included in the measure of same store or like-for-like sales during their first year of life. But they are thereafter.
What this means is that if a company is opening lots of new stores the number of maturing stores can add up to quite a big proportion of the total store estate and give a nice boost to like-for-like sales. This gets investors excited and makes them think they could be buying into a genuine growth business when it's just the basic economics taking effect.
I built up the table below from previous annual results releases in SharePad.
| Year | Stores | Net Change | LFL sales growth (%) |
|---|---|---|---|
| 2015 | 506 | 34 | 1.5 |
| 2014 | 472 | 27 | 2.5 |
| 2013 | 445 | 23 | 3.5 |
| 2012 | 422 | 22 | 4.5 |
| 2011 | 400 | 11 | 3.25 |
| 2010 | 389 | 22 | -1 |
| 2009 | 367 | 13 | -2 |
| 2008 | 354 | 24 | 1.5 |
| 2007 | 330 | 46 | 5.5 |
| 2006 | 284 | 5 |
What you can see is that Restaurant Group's restaurant numbers have been increasing but like-for-like sales growth has been slowing. During the first ten weeks of its 2016 financial year it said that LFL sales had actually turned negative and this is why its share price has crashed.
"After 10 weeks trading in 2016 total sales are up by 6% and like-for-like sales are down by 1.5%. The more challenging trading conditions we saw at the end of last year have continued into the early part of 2016, reflecting a softening in consumer demand and weaker overall consumer confidence. Whilst still early in the year, our assessment is that this more challenging environment and recent trading patterns are likely to persist. Although total sales will continue to increase as our new restaurants open and deliver good returns, in the current environment consistent like-for-like sales increases are likely to be difficult to generate."
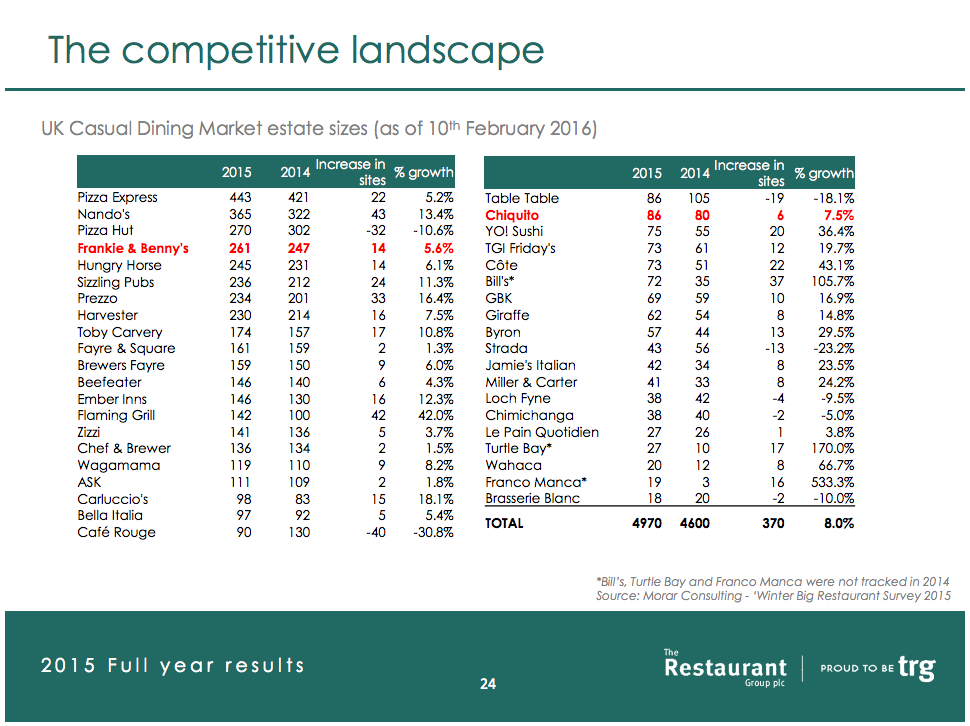
The other thing to worry about is that levels of competition in the branded restaurant sector seem to be increasing.
The slide below was taken from the company's 2015 results presentation. It shows that there are lots of branded outlets which are growing their number of sites. This is probably going to make it harder for many of them to make more money per site.
Restaurant Group is trying to adapt by locating new restaurants away from high street locations where less people are visiting and there is more competition. It is also changing the mix of its restaurant to position them towards more favourable demographic trends.
This means it will be opening less Frankie & Benny's which are focused on the family market and spending more money on its Chiquito chains focused on young people and Coast to Coast which offers a more premium dining experience.
It also has some pub restaurants aimed at affluent pensioners who want to eat out a lot and airport concessions where there is a lot of captive trade available.
The company reckons that it can take the number of restaurants from just over 500 now to over 850. Whether it can do this without affecting the long-term performance of its existing restaurants remains to be seen. Some commentators are worried that its strategy of opening some of its brands next door to each other is a bad idea as one might take sales from the other leaving both with poor returns on investment.
The other area of concern is costs. The company's main costs in 2015 are shown below.
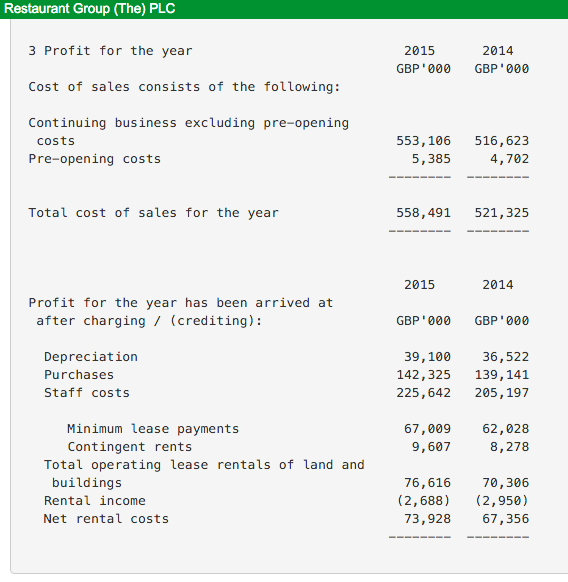
Food costs are not a problem at the moment as food prices have been falling. Utility costs are not an issue either for the same reason. Rents will increase as the number of restaurants increases.
The big concern is what happens to the wage bill with the introduction of a living wage which is set to keep on increasing. It is currently set at £7.20 per hour and is set to rise to £9 by 2020. This is bad news for companies such as Restaurant Group. The company has said it will bump up costs by £2m in 2016 and it will look at things such as staff rostering and efficiency to keep the cost increases in check.
To sum up
- Restaurant Group has had a good track record of increasing sales and profits.
- Returns on investment have been good.
- Cash flow performance has been reasonable despite high levels of investments.
- A rising dividend has been paid comfortably from free cash flow
- Maintenance capex has been less than depreciation which could suggest that the company's true profits are higher than they appear to be.
- The financial position is strong despite a reasonable amount of hidden debt.
- A cheap valuation reflects concerns about the company's future growth prospects.
- LFL sales have started to fall.
- Competition is increasing
- The company is changing the mix of its restaurants to focus on demographic trends and away from declining high streets.
- Rising wage costs from the living wage are a concern.
If you have found this article of interest, please feel free to share it with your friends and colleagues:
We welcome suggestions for future articles - please email me at analysis@sharescope.co.uk. You can also follow me on Twitter @PhilJOakley. If you'd like to know when a new article or chapter for the Step-by-Step Guide is published, send us your email address using the form at the top of the page. You don't need to be a subscriber.
This article is for educational purposes only. It is not a recommendation to buy or sell shares or other investments. Do your own research before buying or selling any investment or seek professional financial advice.