How to analyse a results statement
A company's annual results statement and annual report is one of the most valuable resources an investor can get their hands on. They are freely available to everyone but in my opinion are greatly underused.
Time spent reading these documents is time well spent. When I was a professional analyst I used to spend days, even weeks scrutinising a company's annual reports building up a picture of the company. I was constantly amazed at what I would learn about a business from things such as hidden assets to risks that nobody else was talking about.
If you have the inclination and the time to delve into these potential pots of gold then I am convinced that you will learn a lot more about a company than you will from most share tippers out there. Not only that, you will learn to be an independent thinker and will be less likely to be distracted by the noise and chatter out there on places such as Twitter or internet bulletin boards. You will form your own view of the company not somebody else's.
For readers who are less experienced investors it will take time to become comfortable picking these results statements apart - it was the same for me when I started - but persevere and you will reap the benefits.
You can learn about how to crunch the important numbers in a company's accounts in my Step-by-Step Guide to Investment Analysis and other articles on my ShareScope web page.
In this article, I am going to show you how I look at a company's annual results statement. These are typically released to the stock exchange at 7am on the day they are published via something known as the regulatory news service or RNS for short. RNS is freely available on a number of websites and is also part of the SharePad and ShareScope news service.
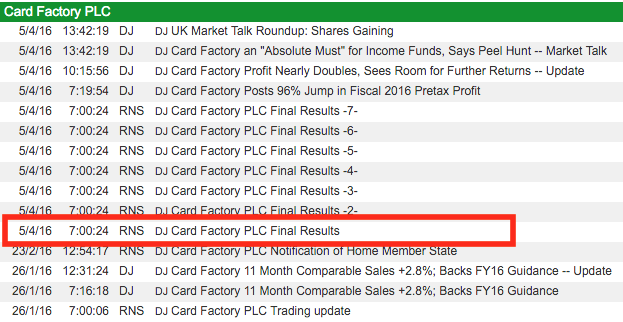
The screenshot above shows an RNS news feed from SharePad. You will also see that it has a Dow Jones (DJ) news feed as well. This will often contain a quick snapshot of the results (you can see this at 7:19) but is unlikely to contain much in-depth information as journalists are under pressure to get stories published.
Phil Oakley's debut book - out now!

Phil shares his investment approach in his new book How to Pick Quality Shares. If you've enjoyed his weekly articles, newsletters and Step-by-Step Guide to Stock Analysis, this book is for you.
Share this article with your friends and colleagues:
Looking at Card Factory's Final Results statement
I am going to be looking at Card Factory's final results for 2015 which were released to the stock exchange on 5th April 2016. I will do this from the position of an investor who has never looked at the company before - as I haven't - but will also give some tips for investors who might own the shares as well.
Don't start at the beginning
Your first inclination will be to start reading the results statement at the beginning. Try to resist this. What you are trying to do is build up your own picture of the company. If you start reading the comments from the management first they might influence your thinking too much as there is a natural tendency for them talk more about the good things and less about things which are not so good.
By looking at the company's financial statements first it is possible to gain a very good understanding of how the company has performed over the year and why. Go through this process first and then read what the company has to say afterwards to see if you agree.
This is quite basic stuff but I hope you will see how useful this process can be.
Income Statement
You need to go through the income statement line by line and look at the changes compared with the previous year. Having a calculator and a piece of paper close to hand will be useful to scribble down your thoughts.
Let's get started.
First of all, you can see below that the results are split into underlying and non-underlying. Underlying results are those that relate to trading activities and don't include one-off gains and costs. They are sometimes called adjusted instead. We are interested in the underlying results. You can also see that the previous year's results are provided as well for comparison.
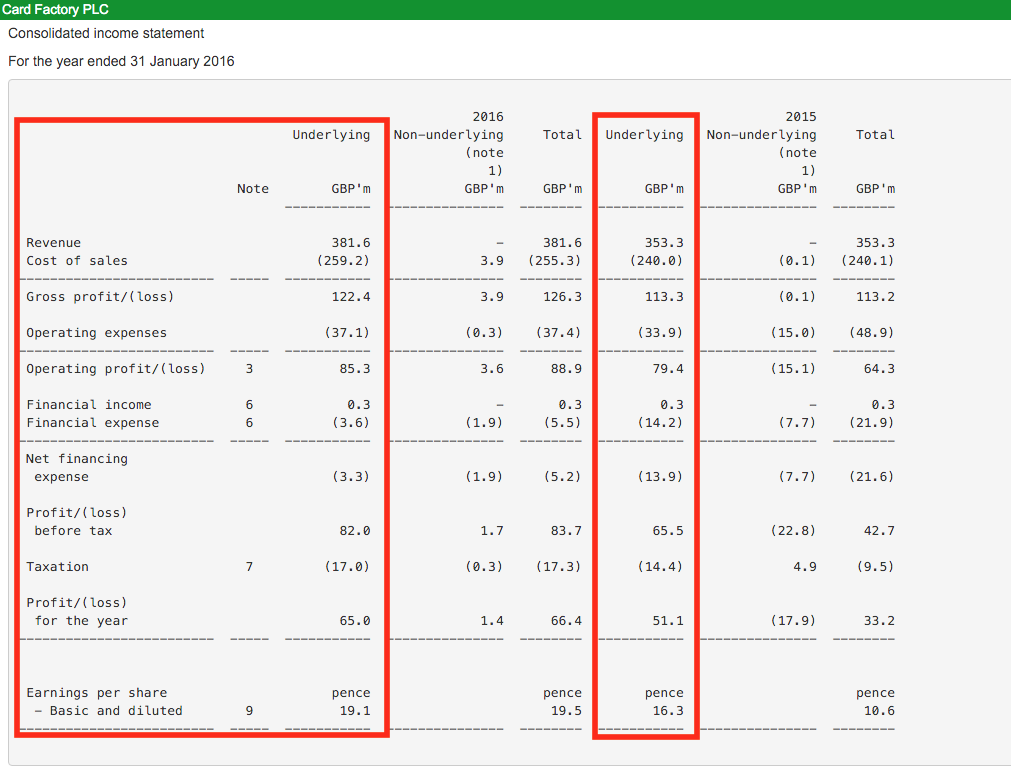
Revenue has increased by £28.3m to £381.6m - an increase of 8%. That's a reasonable rate of growth, but how has it been achieved? Has it come from existing sites, new sites or acquisitions?
Gross profit has increased by £9.1m or 8%. That is the same rate of increase as revenue. This is telling me that gross margins are pretty much unchanged from year to year.
Operating expenses have increased by 9.4% to £37.1m. That is faster than the rate of sales growth which is not ideal. As a result, operating profit has increased by 7.4% - less than sales. Operating margin (EBIT/Revenue) has fallen very slightly but still looks to be quite healthy at 22.35%.
You will notice that next to some of the lines in the income statement there is a reference to a note. These notes give you more information on the number concerned. You should read these as you will usually learn more.
Here is note 3 about operating profit.
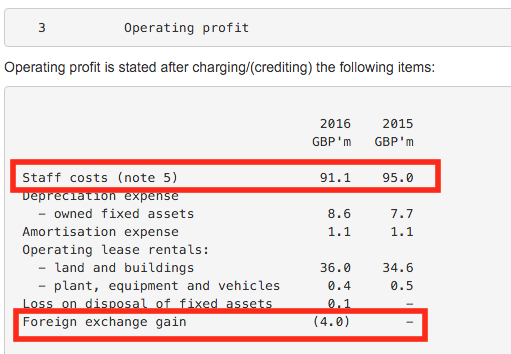
Interestingly staff costs have gone down - are they shedding staff? Note 5 gives us more detail:
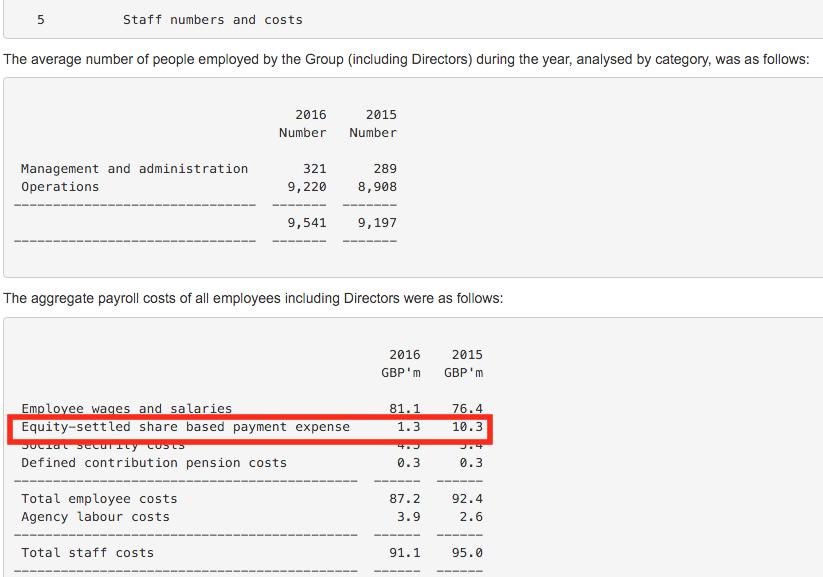
Staff numbers have actually gone up - as might be expected for a growing business - and so has the wage bill. The reduction in staff costs has come from lower share-based payments (remuneration paid in shares rather than cash). This number has fallen by £9m. Has this been included in the company's underlying profit figure? If it has then I would see that as a poor and unsustainable source of profits growth. Hopefully, more will be said on this as I wade through the statement.
Note 3 also highlights a foreign exchange gain which has reduced operating costs and boosted operating profit by £4m. Again, hopefully this is not included in the underlying profit number.
We can also see that the rent bill (operating leases) is up, presumably because the company has more shops open than it did last year. Fixed charge cover is over 3 times though which is very comfortable.
So, what about those staff costs? Thankfully, help is at hand as the company has provided a note on the underlying profit numbers and what has been excluded.
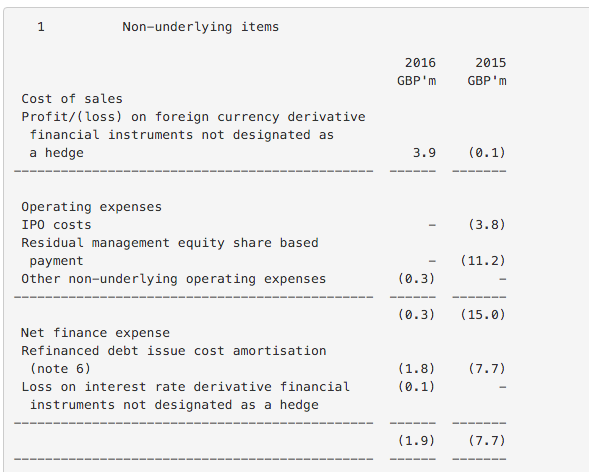
We can see that most of the foreign exchange gain has been excluded. It's also good to see that the share-based payments which saw a big drop in 2016 have been excluded from the underlying profit figure and is explained below:
"On admission to the London Stock Exchange, shares with a fair value of GBP9.8 million were issued at nominal value in relation to residual management equity as detailed in the IPO prospectus. Employer national insurance of GBP1.4 million was incurred on the issue of the shares. These non-recurring share based payments are presented as a non-underlying item in the prior year income statement."
So not only have the share-based payments been treated as non-underlying but they were dealt with in the previous year's accounts.
I'll repeat the income statement here as it is a few pages back now.

There has been a big fall of £10.6m in the Net financing expense (which is largely the balance of interest paid and received). As a result, pre-tax profit has increased by £16.5m or 25.1%. This is much faster than sales grow but a large chunk of growth has come from falling interest expenses. This is unlikely to be repeated going forward. Note 6 gives more detail.
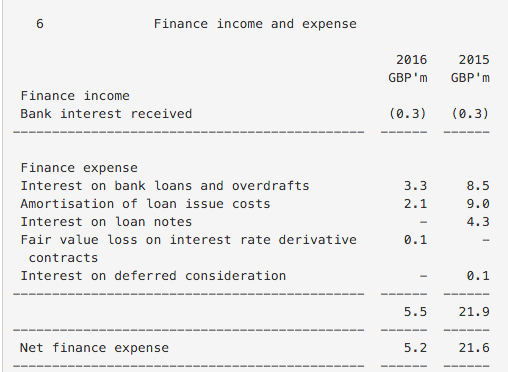
First of all, you may notice that the figures for the net finance expense are different to those stated in the underlying income statement. This is because the amortisation of loan issue costs is treated as a non-underlying, or one-off, item.
We can see in the note above that the loan notes have clearly been paid off and interest on existing borrowings has fallen sharply. This is telling me that company debt is probably down sharply and interest rates on that debt might be lower as well.
With underlying operating profits of £85m there is plenty of headroom to pay the interest bill on outstanding borrowings.
Going back to the income statement, taxation is higher due to higher pre-tax profits. The tax rate (17/82) has fallen to 20.7% from 22% (14.4/65.5). There is nothing too untoward here.
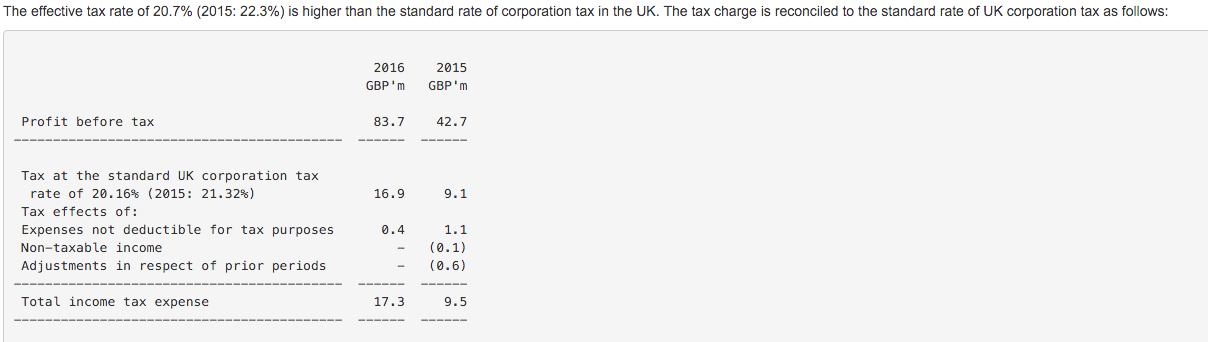
This feeds through to a profit increase for the year of 27.2% which looks very impressive. However, a big part of this has come from lower interest expenses and a lower tax rate.
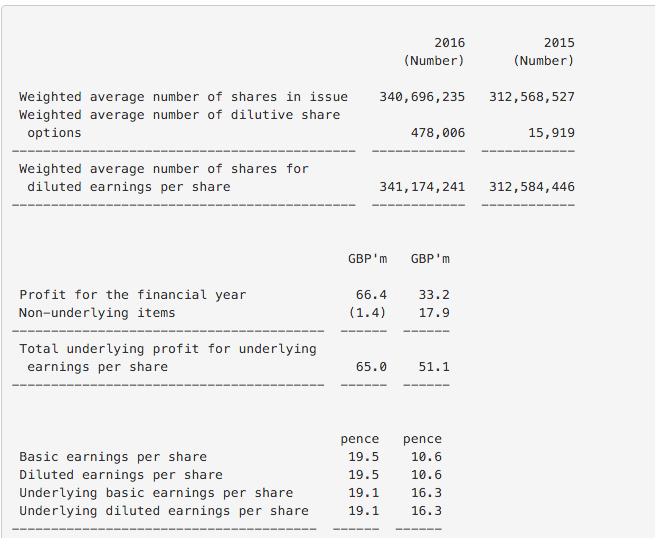
Earnings per share (EPS) growth is up by only 17.2%. This is telling me that there is a higher number of shares in issue as is shown below. Why has the average number of shares gone up?
Whilst working my way through the notes, I also came across this note on dividends:
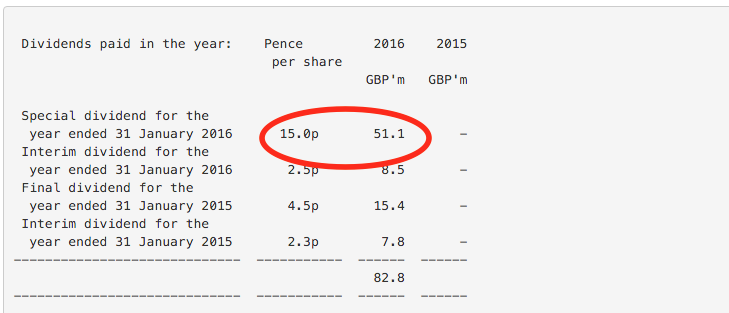
The company didn't pay any dividends in 2015 but has made up for it in 2016. A special dividend of 15p per share costing £51.1m has been paid this year. Special dividends are usually a good sign of a cash-generative company. I like the fact that a special dividend has been paid rather than a share buyback.
It is often true that companies that pay special dividends often do so again in the future. Regular dividends paid out during the year have cost £31.7m. The total dividend payout of £82.8m is more than the company's profits for the year and means that some of it has been paid from previous profits. I expect this to be shown up on the company's balance sheet.
I can also see a comment about the final dividend declared (but not paid) for 2016:
"The Board is recommending a final dividend in respect of the financial year ended 31 January 2016 of 6.0 pence per share (2015: 4.5 pence per share)..."
The final dividend is being increased by 33% and the total dividend is 8.5p compared with 6.8p last year - a rise of 25%. This is good to see and perhaps a sign of confidence. I already know that underlying EPS has increased by 17.2% so dividends are increasing faster than earnings growth.
If I calculate the dividend cover (EPS/DPS) I can see that it is 2.24 times (19.1p/8.5p) compared with 2.4 times (16.3p/6.8p) in 2015. This is a comfortable level of dividend cover and highlights the scope for further growth.
Balance Sheet
I learn a bit more from looking at the balance sheet. I can see that there hasn't been much investment in fixed assets as they are largely unchanged. A slight increase in property, plant and equipment tells me that capex has been slightly more than depreciation.
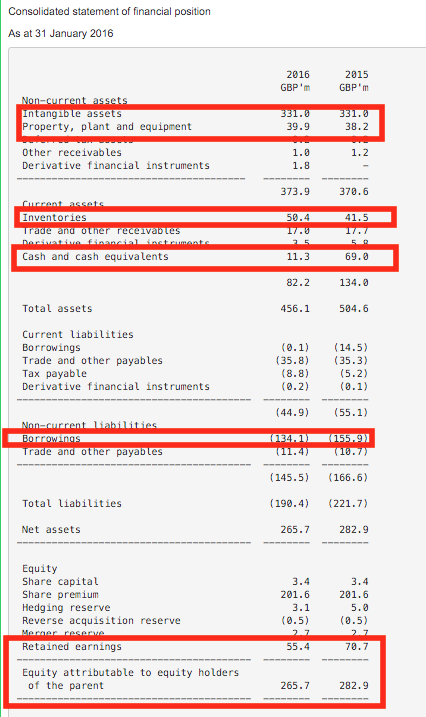
Inventories (sometimes called stocks) have increased quite a lot. The £9m higher balance represents an increase of 22% compared to a growth in sales of just 8%. This is quite a big difference and might be a cause for concern. The company might be building up stocks to prepare for the opening of new shops. However, the rise in the value might be telling me that it has lots of unsold cards and might have to cut prices to shift them which would mean lower profit margins.
The cash balance has fallen sharply. I can see lower down the balance sheet that borrowings have fallen too. So some of the cash has been used to pay off debt. I already know that a big special dividend has been paid as well which will have eaten into the cash balance.
Shareholders' equity is lower largely due to the decrease in retained earnings (accumulated profits which have not been paid to shareholders) as dividends paid were bigger than profits this year.
From the balance sheet, I can calculate the capital invested in the business and see how it has changed.
| Card Factory (£m) | 2016 | 2015 |
|---|---|---|
| Total assets | 456.1 | 504.6 |
| Less non-debt current liabilities | -44.8 | -40.6 |
| Capitalised leases (7x rents) | 254.8 | 244.3 |
| Capital Employed | 666.1 | 708.3 |
Equity | 265.7 | 282.9 |
| Total borrowings | 134.2 | 170.4 |
| Other long-term liabilities | 11.4 | 10.7 |
| Capitalised leases(7x rents) | 254.8 | 244.3 |
| Capital Employed= A | 666.1 | 708.3 |
Underlying operating profit | 85.3 | 79.4 |
| interest on leases at 7% | 17.8 | 17.1 |
| Adjusted profit = B | 103.1 | 96.5 |
| ROCE (A/B) | 15.48% | 13.62% |
Capital employed has come down by just over £40m. Off-balance sheet debt (the value of capitalised leases) hasn't gone up much. With profits rising, ROCE has increased to a very respectable 15.5% which tells me that I might be looking at a reasonable business here.
Note: I should have used average capital employed to calculate ROCE but I am making rough notes and allow myself to be a little bit lazy for once.
Cash flow statement
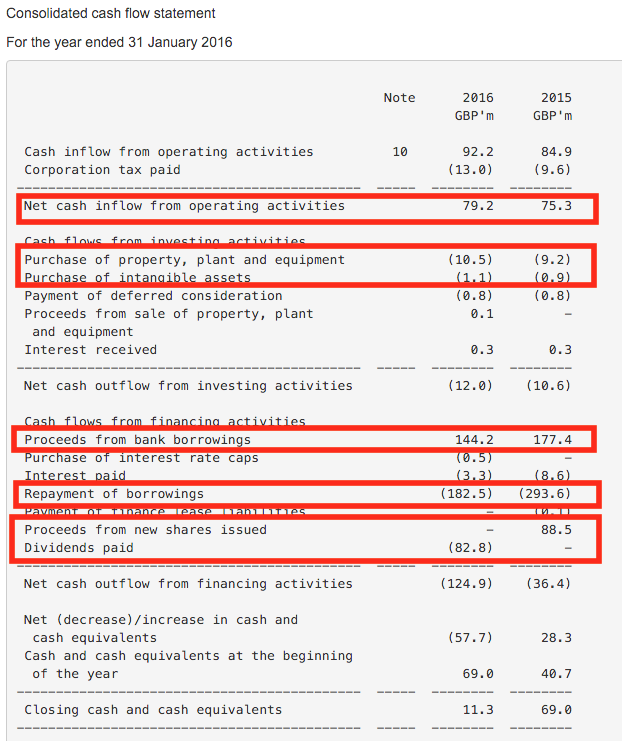
There is slightly more cash coming into the business from operating activities. Note 10 gives more detail:
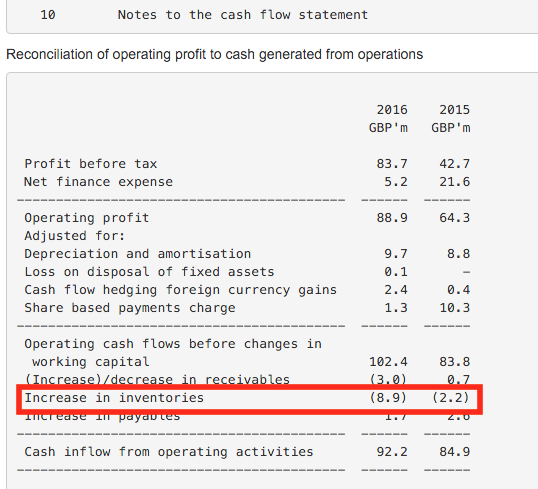
Profits are higher but higher inventories have eaten up a reasonable amount of cash.
Going back to the cash flow statement, spending on new assets is about the same as last year and I can also see that Repayment of borrowings is higher than the amount of new loans taken on (Proceeds from new borrowings). £88m was raised from new shares last year when they were listed on the stock exchange in May 2014. This explains why the average number of shares used to calculate EPS has gone up. The new shares were only counted for part of 2015 whereas they were included for all of 2016.
I've also calculated that free cash flow to equity has increased by 13.5% from £56.9m in 2015 to £64.6m in 2016 and is very close (in fact higher in 2015) to the post tax profit figure. This is telling me that the quality of profits is good and that free cash dividend cover is good too.
What I have learned
- Revenues are growing at a reasonable rate but I don't yet know why.
- Profit margins are down slightly.
- Profits have been boosted by much lower interest costs and a lower tax rate.
- The underlying dividend has grown faster than underlying EPS.
- A special dividend has been paid - some of it from past profits. This is usually a sign of a good, cash-generative business.
- Stocks have risen faster than revenues. Could this mean that prices might have to be cut to get rid of unsold cards and hurt profit margins?
- Debt levels have been coming down. Interest cover and fixed charge cover ratios are comfortable.
- Capital employed has fallen and ROCE has increased.
- ROCE is respectable at over 15% when adjusted for hidden debts (lease costs).
- Free cash flow has increased and is close to profits indicating high-quality profits.
- Dividends are comfortably covered by free cash flow.
What the company is saying
Now it is time to read what the management is saying about the company and its future prospects. Here are what I see as the key observations with supporting quotes from the results statement:
The chief executive is leaving
This might worry some people as many of them seem to have developed a knack for getting out when things are good and not long before they turn sour. Reading further, I can see that he has been in charge for 13 years and wants to retire. No-one works forever.
Underlying sales growth seems to be reasonable
Like-for-like sales have increased by 2.8% which is a reasonable number. There could be a maturing store effect which is boosting this number.
"This strong performance was driven by a number of factors, including further improvements in the quality and range of our card and non-card offerings, benefits of our new EPOS system, new merchandising initiatives and further market share gains as stores mature."
The company is opening lots of new stores and most of them are making money
This trend looks set to continue and should help increase future sales and profits.
"The Group's established new store roll out programme continues to be an important driver of sales growth for the business.
In the year under review, 50 net new stores were opened (FY15: 51), bringing the total estate to 814 stores at the year end. During the year 10 stores were closed (FY15: 5) and 6 stores were relocated (FY15: 9).
The overall quality of our new store openings and their performance to date continues to be in line with our expectations. The quality of our retail estate remains high. Of our stores open for over one year, only five (less than 1% of the estate) were loss making, and their aggregate loss was only GBP0.1m at store contribution level.
We have a strong pipeline of additional new store opportunities and remain confident of opening a total of approximately 50 net new stores in the new financial year."
Online sales are growing strongly but remain a small part of the business
"Our online operations have had another strong year with total Group online revenues growing by 22.8% to GBP19.2m (FY15: GBP15.7m)."
The mix of the business continues to move towards "non-card" sales
"Single cards, Christmas boxed cards and non-card products all contributed to the like-for-like sales growth in Card Factory stores, with a particularly strong performance in non-card as a number of new ranges were introduced into store. As a consequence, there was a continuation of the marginal mix shift to non-card, the full year mix being 56.4% single cards (FY15: 57.9%), 41.3% non-card (FY15: 39.9%) and 2.3% Christmas Box Cards (FY15: 2.2%). We expect this trend to continue as we further improve our non-card offering."
This looks like it could be a positive development and reduces the exposure to a competitive card market.
Cost pressures are increasing
Wages are going up.
"The implementation of NLW [National Living Wage] will increase store wages by approximately GBP2.5m per annum (based on the current store estate), over and above the cost increase we were anticipating from the National Minimum Wage. We have identified initiatives to mitigate approximately GBP1m of the FY17 increase and we are targeting a similar level of mitigation in future years. Subject to LFL sales growth, we therefore anticipate a small annual increase in this cost ratio over the medium term."
Sales growth from existing stores will be vital to offset these wage pressures.
Future property costs could come down
Card Factory has some store leases that are coming up for renewal. As the current rents on some stores were set before the last recession the company seems confident that it can negotiate better deals when current contracts expire.
"We believe that there remains an opportunity for further savings as these older leases come up for renewal over the coming years."
Exchange rate changes could see the cost of materials increase
For me, this is the most worrying part of the results statement. Card Factory makes most of its own cards for sale. This means it buys the raw materials to make them.
"With slightly over half of the Group's annual cost of goods sold expense relating to products sourced in US Dollars, the Group takes a prudent but flexible approach to hedging the risk of exchange rate fluctuations...
...we expect foreign exchange margin pressure to remain an area of concern for FY17 and possibly beyond, with particular uncertainty arising from the debate around and potential outcome of the EU referendum."
We already know that margins fell slightly in 2016 and the company is warning that they might fall in 2017:
"Looking forward to FY17, we anticipate that our margins will be adversely impacted by the aforementioned cost headwinds, together with the anticipated increase in share based payment charges relating to subsequent LTIP awards and the proposed 2016 SAYE scheme."
But it reckons it might be able to limit the damage:
"Given the best-in-class margins generated by our unique vertically integrated model, compared to our principal competitors we believe that the impact on our overall margins will be relatively low."
The increase in inventories is probably nothing to worry about
"...inventory increases from a combination of new store openings, higher Christmas carry over and the timing of purchases given the earlier Mother's Day in 2016."
There might be a slight concern from unsold Christmas cards but the company has given a good explanation for its inventory increase.
More special dividends are possible
"We believe that there is significant potential for further returns of surplus cash to shareholders in line with our stated policy."
Final thoughts
This company looks to be in a good state of health. It will open more stores in 2017 and maturing stores should keep sales increasing.
The uncertainty on the outlook for costs might be a little unsettling and could cause City analysts and investors to be uncertain about 2017 profit forecasts. It would not be surprising to see the rate of profit growth slow, particularly as the benefits from lower interest costs and lower tax rate will not have a big effect.
I have not covered everything here and have probably missed a few points. For instance, I have not looked at the company's valuation or analysts' forecasts but you can do this easily in SharePad and ShareScope.
I hope you can see the value in reading these results statements and what you can get from them. This kind of basic analysis can be very rewarding and something you will get better at the more you do it. What I have covered in this article can be comfortably done by most people in under an hour.
If you have found this article of interest, please feel free to share it with your friends and colleagues:
We welcome suggestions for future articles - please email me at analysis@sharescope.co.uk. You can also follow me on Twitter @PhilJOakley. If you'd like to know when a new article or chapter for the Step-by-Step Guide is published, send us your email address using the form at the top of the page. You don't need to be a subscriber.
This article is for educational purposes only. It is not a recommendation to buy or sell shares or other investments. Do your own research before buying or selling any investment or seek professional financial advice.