Tutorial: The Level 2 View
The Level 2 view is available for subscribers of SharePad Pro only.
To access the Level 2 view, click on the green Level 2 button on the main toolbar.

Note: the button for the current selected view is coloured white.
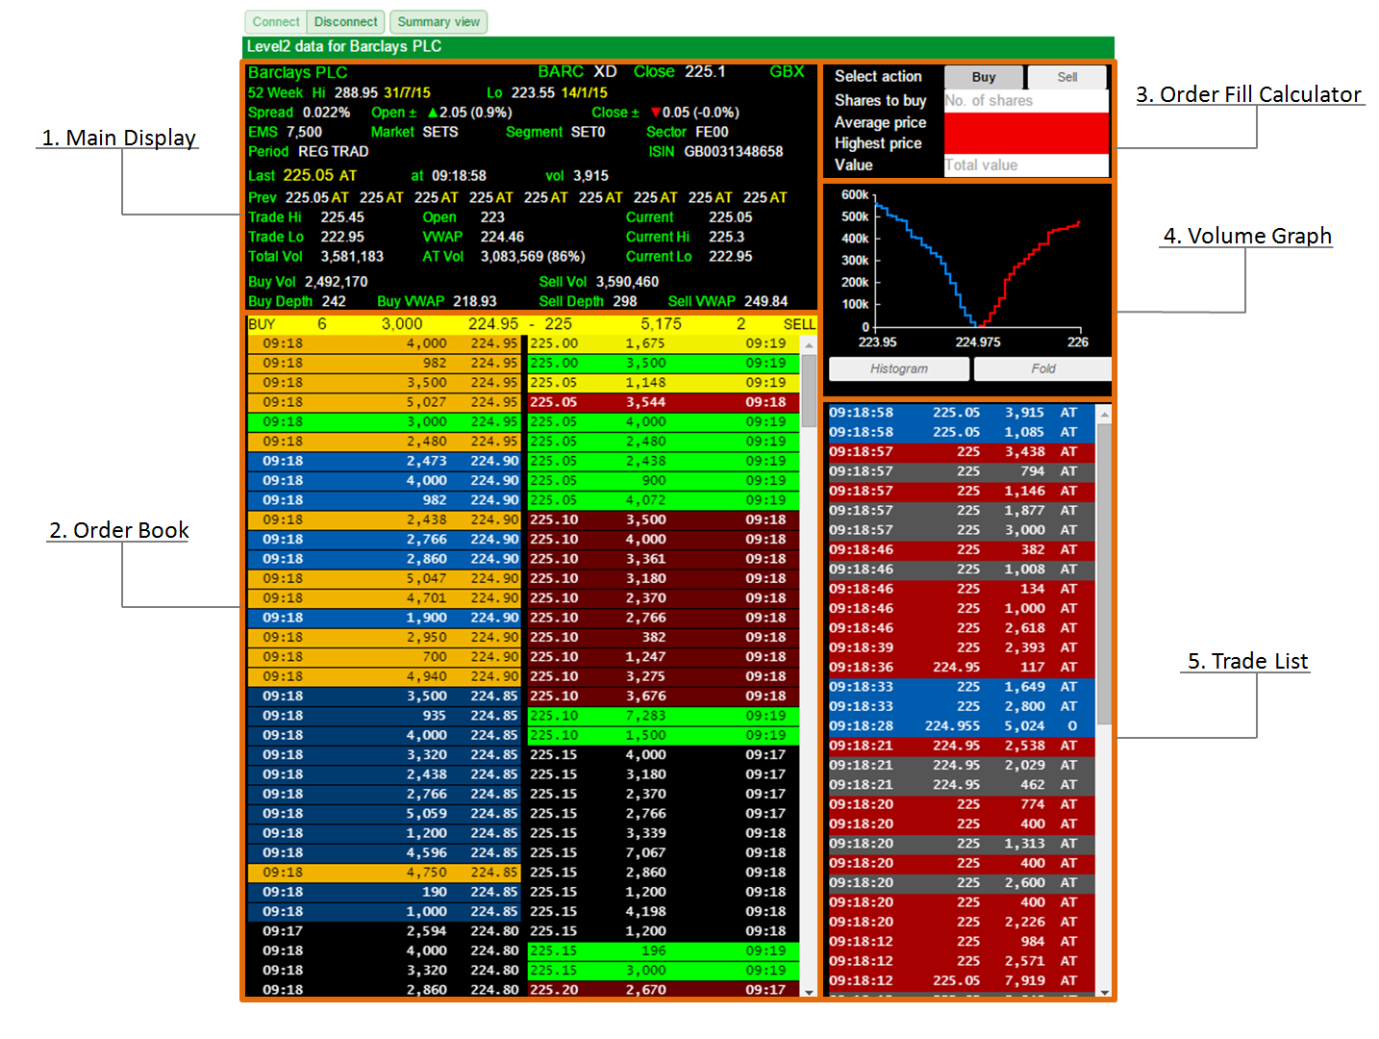
The Level 2 screen is designed to show you how the order book looks at that moment in time for a given share on the London Stock Exchange.
The Level 2 screen is broken down into five distinct sections. In this tutorial we will cover each section in turn.
- The Main Display
- The Order Book and Yellow Strip
- The Order Fill Calculator
- The Volume Graph
- The Trade List
The Main Display
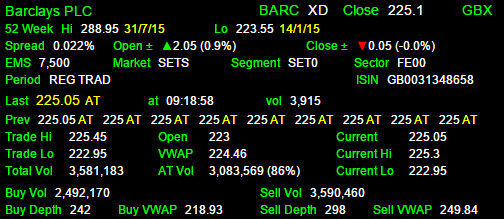
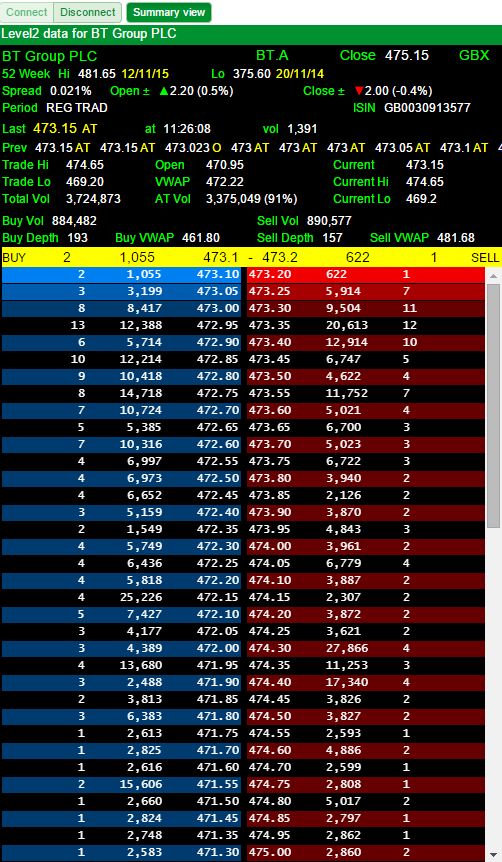
The main display shows you an array of information about the current status of the share you have selected.
Line 1:
- Name
- EPIC: this is also known as the TIDM or Ticker
- XD: this indicates that the share is currently trading ex-dividend
- Close: the previous trading day's close.
- GBX: this indicates the currency denomination that the share is traded in (GBX is pence; GBP is pounds).
Line 2: this shows the 52 week High and Low values for the share and the dates on which those values were reached.
Line 3: this has details of the share's current spread, the change from the Open and the change from the Close.
Line 4:
- EMS (Exchange Market Size): This represents the number of shares a market maker is compelled to trade that the price they are currently offering. If you attempt a trade that exceeds this value with a market maker then they are permitted to negotiate on the price. Note: EMS was formerly called NMS (Normal Market Size)
- Market: this refers to the LSE trading service where a share is traded, i.e. SETS, SEAQ, SEATS, IOB and ETR.
- Segment: a division of the market, characterised by a grouping of similar participants and similar tradable instruments by currency with in that market segment.
- Sector: a sector is a division of a market segment defined by the LSE, e.g. FS10 (FTSE 100), AF50 (AIM). Each market sector consists of a schedule of periods, each of which is assigned a start time, thus enabling different rules to come into operation at different times of the day.
Line 5:
- Period: a time period defined by the LSE. There can be two periods associated with each share: one for the orderbook (and the share itself) and one for the quote book if present.
- ISIN: the International Securities Identification Number. A unique identification number used to identify the security. Note: It is possible to search for securities using the ISIN.
- During an auction line 5 will also show the time elapsed or the time remaining.
Line 6 shows details of the last trade including the price, trade type, time and volume traded.
Line 7 shows the most recent trades including their price and type.
Lines 8, 9 and 10:
- Trade Hi and Trade Lo are the highest and lowest Trades of the days so far.
- Current Hi and Current Lo are the highest and lowest Automatic Trades (AT) or the Uncrossing Trade (UT) . If no trades are present then the Mid will be used.
- Open: Open for the day.
- VWAP: Volume Weighted Average Price
- Total Vol: the Total Volume traded so far for the day.
- AT Vol: the Total Automatic Trade Volume traded so far for the day and includes the percentage that this represents of the total volume traded.
Line 11 shows the total volume of shares available to Buy and Sell on the order book.
Line 12:
- Buy Depth: the total number of orders on the buy side of the order book
- Buy VWAP: the average price of the shares on the buy side of the order book, weighted by volume
- Sell Depth: the total number of orders on the sell side of the order book
- Sell VWAP: the average price of the shares on the sell side of the order book, weighted by volume
You can control what information is shown on the order Main Display using the Design button in the bottom left-hand corner of the order book.
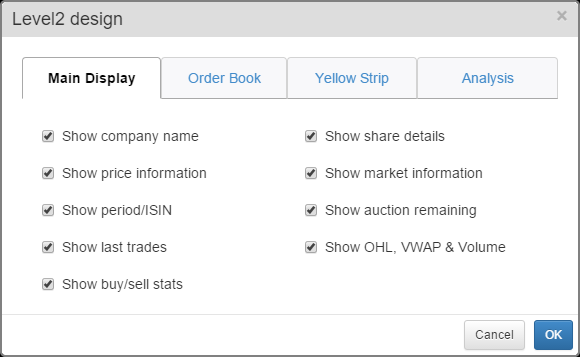
Show company name represents the information on Line 1; Show share details represents the information on Line 2 and so forth (working left to right and down the dialog window).
If you untick all of the options then no information is shown in the Main Display and the Yellow strip will be at the top of the window.
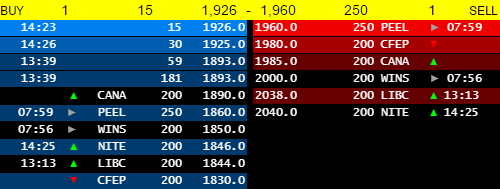
The Order Book and Yellow Strip
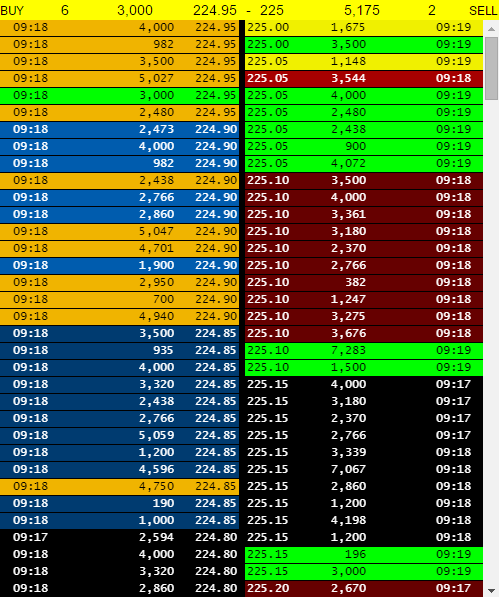
The order book and the Yellow Strip are split into two sides; the buy side and the sell side.
On the Yellow Strip the values are mirrored on the left hand side you have:

- 10% / Buy: if the depth of the order book has been reduced, the percentage of the order book currently being shown. Otherwise Buy is displayed on the left and Sell is displayed on the right.
- 2: the number of orders available at the current bid price.
- 5894: the total current volume offered at the bid price.
- 222.95: the current bid price.
- The equivalent information is displayed on the sell side e.g. 223 is the current offer price.
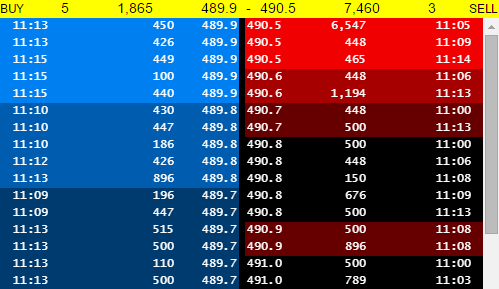
Order colours
On the order book, the buy and sell orders are graduated in blue on the buy side and red on the sell side. Blocks of orders with the same price per share are coloured the same.
- Orders that flash green indicate the appearance of a new order.
- Orders that flash yellow (like those at the top of the sell side in the above example), indicate an order that has changed.
- Orders that flash orange indicate a deleted order.
On the order book you may also see 4 character market-maker codes. These will be accompanied by arrows to show if the market-maker has increased or decreased their price when they last changed it.
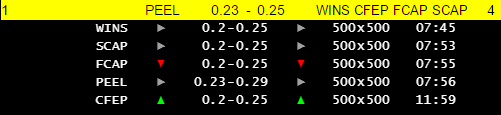
SEAQ Stocks
The SEAQ market is designed for smaller companies listed on the AIM market whose shares are generally illiquid. It allows market-makers to provide liquidity for the company in question
Because of this, the order book features a different design:
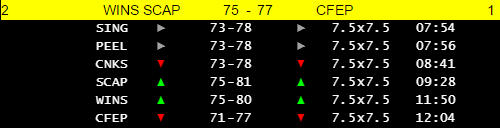
On each line you can see the 4 digit code for the Market Maker, their current bid and offer prices, along with arrows to show the latest change in both. After this, you will see the number of shares available for trade in an abbreviated form.
For example, 7.5x7.5 this represents 7,500 shares on the bid and offer sides of the order book.
Depending on the stock the amount of shares made available for trade by the Market Makers can be in the hundreds of thousands so this abbreviation method helps to save space on the order book.
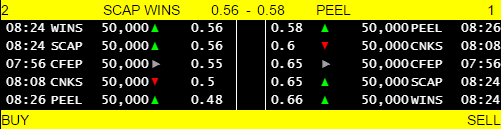
SETSqx Stocks
SETSqx (Stock Exchange Electronic Trading Service - quotes and crosses) is a trading service for securities less liquid than those traded on SETS.
SETSqx combines a periodic electronic auction book with standalone non-electronic quote driven market making. Electronic orders can be named or anonymous and for the indicated securities order book executions will be centrally cleared.
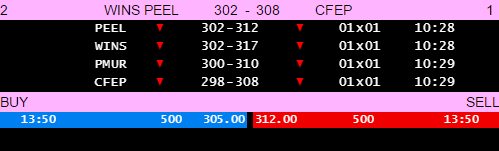
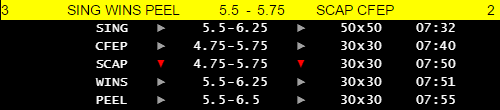
The SETSqx order book looks like a cross between the SETS and SEAQ order books.
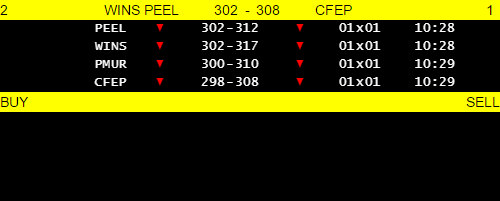
At the top of the order book you have the market-makers' section and below that you have section where orders are shown.
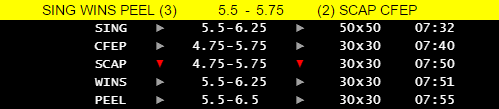
For the majority of SETSqx stocks there are auction periods that end at 8:00, 9:00, 11:00, 15:00 and 16:35.
With the exception of the 16:35 auction there is a 10 minute auction call period before each auction. It is only during these periods that orders are shown on the order book. The yellow strip is coloured pink during auctions by default.
There are a small number of SETSqx stocks that have no market-makers. They are in the segment SSX4. These stocks behave as though they are in auction all day with uncrossing periods at the same times as normal SETSqx stocks.
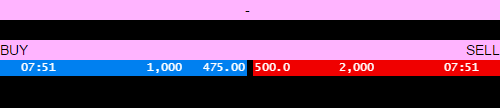
Orders placed on these stocks will appear on the order book at any time and will remain for 90 days.
Summary View Button
At the top of the Level 2 screen there is a button labelled Summary View.
If you select this then for SETS stocks the orders are aggregated together by price.
On each row you'll see the number of orders, the total number of shares to be traded and the price per share at which those orders have been placed.
There are options in Design that can change the way the Order Book looks:
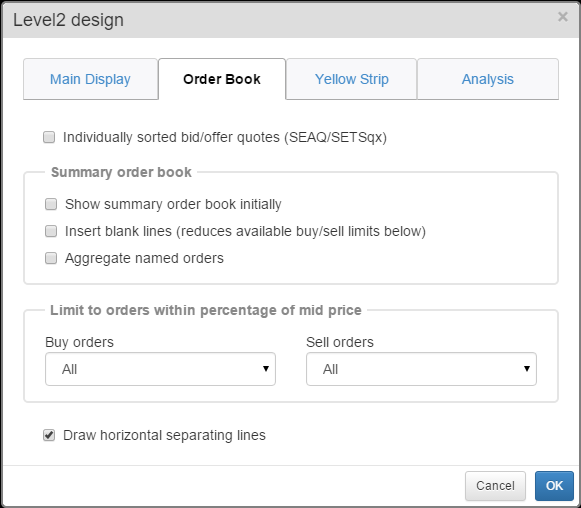
Individually sorted bid/offer quotes (SEAQ/SETSqx): this changes the way the order book is drawn for these two trading systems. The market-maker quotes are shown with the full values rather than their abbreviated version.
Show summary order book initially: this shows the summary view initially to speed up drawing of the Level 2 screen. This can help when you do not have a robust connection to the internet.
Insert blank lines: when you are looking at the order book with the summary view turned on orders at the same price are aggregated together. They are then listed in sequential order without taking into account if there are no orders at particular values. This option will insert blank lines whenever there are no orders at a particular price point.
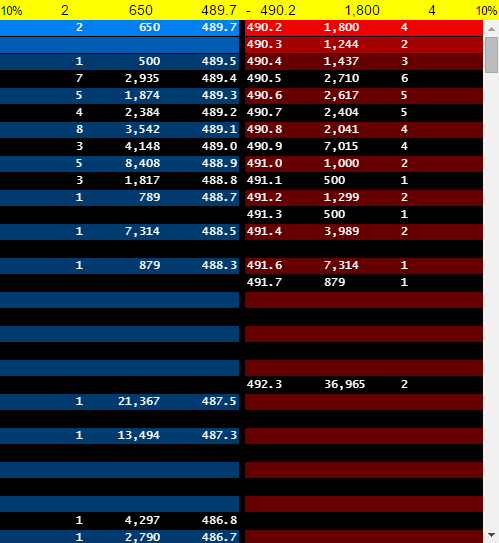
Here you can see that the insert blank lines option has been turned on and there are gaps on the buy side at 489.6 and 488.6 for example.
Note that the order depth has been reduced to 10%.
Aggregate Named Orders: Named orders are those orders that have been listed by market-makers. When you have the summary view option turned on these are not, by default, aggregated together.
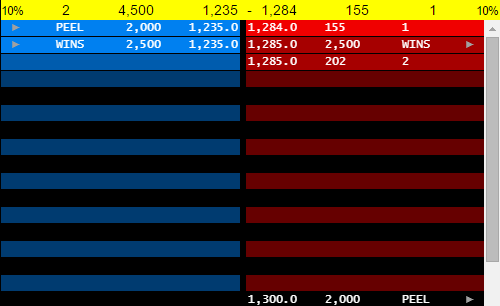
Here you can see that there are two orders listed by market-makers at the same price on the buy side and the single order listed by WINS on the sell side is also at the same price as two other non-named orders. However, they have not been aggregated together.
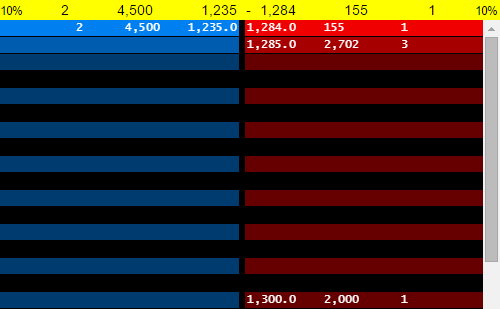
With the aggregate named orders option turned on the market-maker orders are aggregated together with the each other and the non-named orders.
Limit to orders within a percentage of sell price: this reduces or increases the depth of the order book shown on the screen.
The available options are:
- All
- 1%
- 2%
- 5%
- 10%
- 25%
- 50%
Note that selecting the Insert Blank Lines option reduces the number of options available by removing the 25%, 50% and All options.
Draw horizontal separating lines: you can see from the image above that there are is a thin blank line drawn between orders shown on the order book. Deselecting this option will remove this line.
There are also options in Design that can change the behaviour of the Yellow Strip.
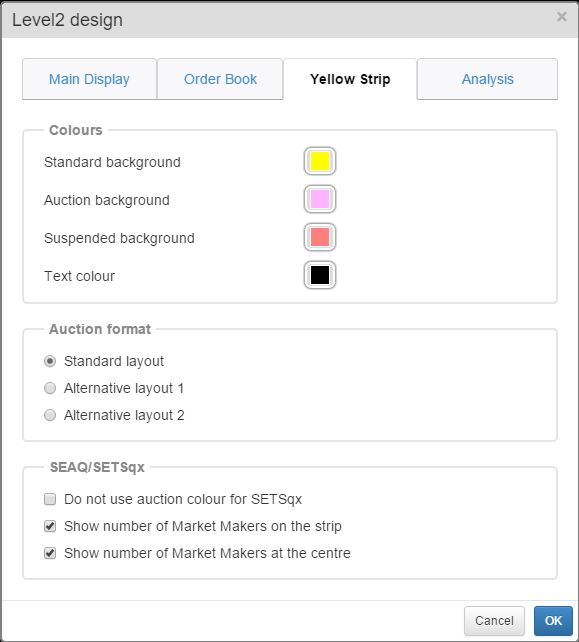
The colour of the background and text on the yellow strip can be changed from this part of the dialog box.
The Auction format of the yellow strip can also be changed.
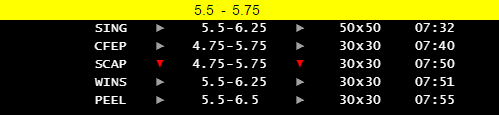
- Standard layout: shows the indicative uncrossing price and volume.
- Alternative layout 1: shows the indicative uncrossing price in the centre of the strip. On the left and right of the strip are, respectively, the total volume of buy orders equal to or better than the uncrossing price, and the total volume of sell orders equal to or better than the uncrossing price.
- Alternative layout 2: the same as alternative layout 1, but with the higher of the two volume figures displayed as a difference from the lower figure.
SEAQ/SETSqx options
- Do not use auction colour for SETSqx: as mentioned above SETSqx stocks either have multiple auctions during the day or, in the case of those stocks in the SSX4 segment, they are constantly in an auction. This option stops those stocks turning pink when they are in an auction. This helps to stop confusion with those stocks SETS stocks that have entered an unscheduled auction.
- Show number of Market Makers on the strip: this shows the 4 digit market-maker codes on the yellow strip for those market-makers with the best bid and offer quotes. It also shows the number of market-makers on the far-left and far-right-hand sides of the yellow strip.
Deselecting this option just shows the current bid and offer on the strip.
- Show number of Market Makers at the centre: This changes where the number of market -makers is shown. Rather than on the far left and right the number appears in brackets beside the market-maker codes.
The Order Fill Calculator
The Order Fill Calculator appears at the top right hand corner of the Level 2 screen. This dynamically calculates the price or number of shares for an order based on the Level 2 order book, as it appears on the screen at that moment in time.
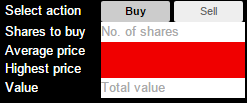
You can enter values in either the No. of shares field or the Total value field. When you enter a value in one of these two fields the calculator populates the other for you. As the order book changes the value calculated by SharePad will also change.
You can also choose between the Buy tab and the Sell tab.
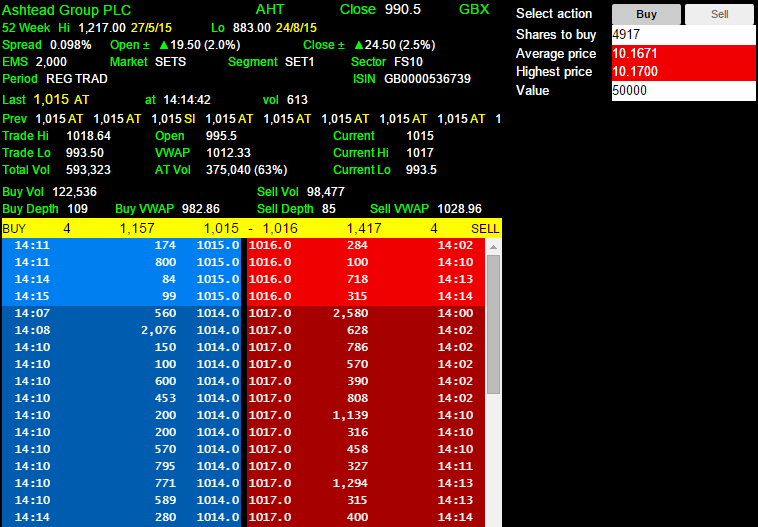
In this example, we have entered a value of 50000, indicating that we wish to purchase £50,000 of shares in Ashtead Group (AHT). The calculator shows that we need to buy 4,917 shares with an Average price of £10.1671 and a Highest price of £10.17
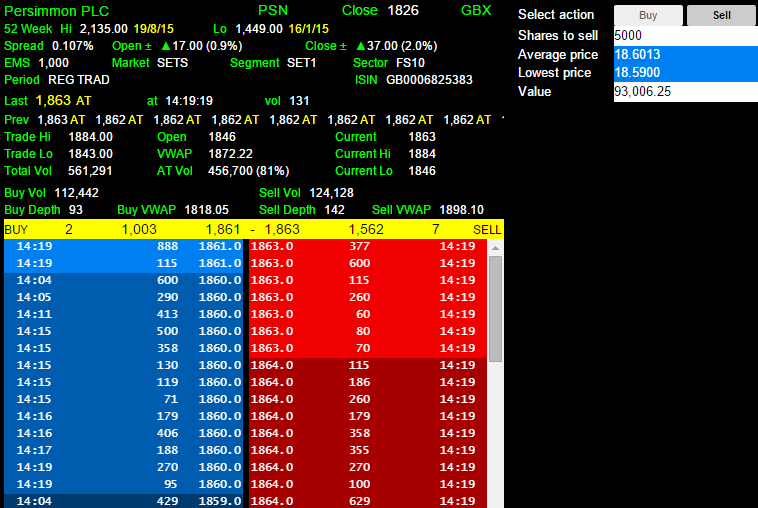
In this example, we have decided to sell a holding of 5,000 shares in Persimmon (PSN). The Order Fill Calculator is showing me that we will get a return of £93,006.25 for my holding and the Average price paid for my shares will be £18.6013 and the Lowest price paid for my shares will be £18.5900.
The Volume Graph
The volume graph shows the price of the orders on the x-axis and the amount of shares waiting to be traded at that price on the y-axis.
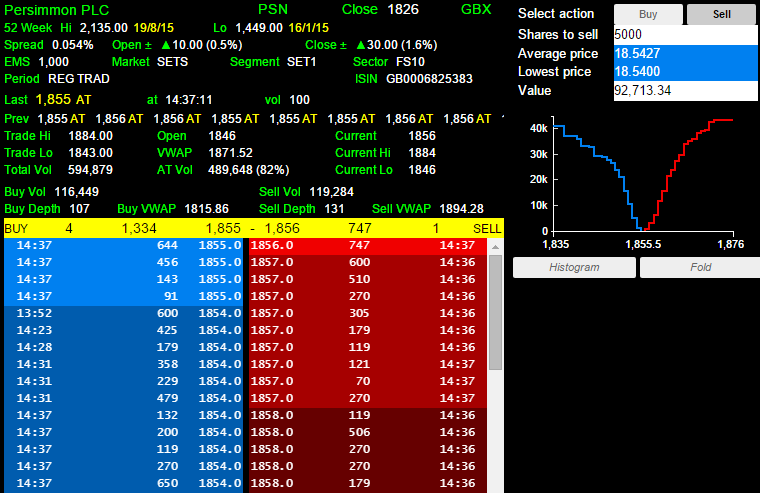
The volume graph can be set to display as either a stepped line graph or a histogram. It is also possible to Fold either chart. Folding the chart draws the buy and sell side over the top of each other. If the chart is not folded then the buy and sell sides are draw to the left and right of the mid price which is also the centre point on the y-axis.
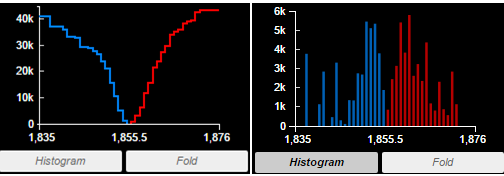
Here you can see the stepped and histogram charts. Note how the volume on the stepped chart accumulates whereas on the histogram each bar represents the volume available at that price.
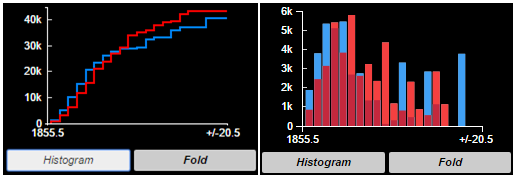
Here we have folded both chart types. Using this method it's easier to see that there is greater total volume on the sell side of the order book. You can also see where there are large tranches of volume waiting to be traded.
The Trade List
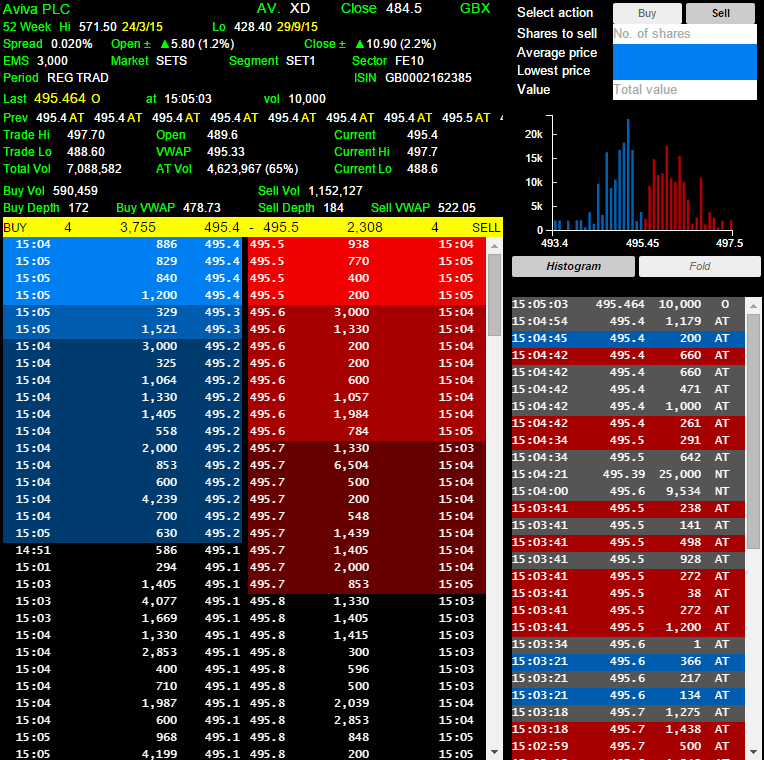
Here you can see the Trade list for Aviva (AV.).
You can see that the different trades are coloured. The colourisation depends on whether the trade went through closer to the buy price or the sell price when the trade was executed. If the trade value was too close to the mid then the trade is coloured grey.
You can also see that the trades have codes.
Current trade types:
- AT - Automatic Trade: An automatic trade generated by the SETS system through the order book.�
- OB - Off-book Trade: A trade that occurs outside of the Order book, such as through market makers, or privately negotiated (typically for larger trades).
- UT - Uncrossing Trade: A trade where buyers on the bid and sellers on the ask match together in a single trade, such as at the end of an auction period.
Historical trade types:
- O - Ordinary Trade: A standard trade made through the Market Makers and dealt at normal settlement date.
- NT - Negotiated trade: a Negotiated trade made with immediate publication. These are usually large volume trades where the price has been negotiated. One of the two in the example above is for 25,000 shares and the other 9,524.
With Trades that are not Automatic or Uncrossing Trades, it is not possible to know when the trade was executed, only the time of publication is available.
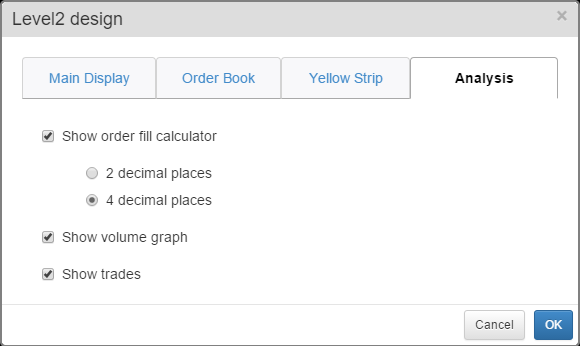
The Order fill calculator, Volume Graph and Trade list can all be toggled on or off via the Analysis tab on the Level 2 design dialog window.
It is also possible to change the Order fill calculator between showing 2 or 4 decimal places.