Tutorial: Creating bespoke List tables
In this tutorial, we look at how to populate a List table with the information most relevant to your investing strategy.
For more about customising the appearance of List tables, please click here.
In this example, you can use one of the blank List Tables and rename it to "Share Performance". If you are using more than one List Table, it is a good idea to give each a specific and unique name. Note that in ShareScope Gold, the name of the selected table appears at the very top of the screen.

The default blank tables have two columns: No. and Name. From here you are able to start populating the table with new column data.
We'll add the following column types:
Event Flags
The Flags column highlights a recent or upcoming event - such as an ex-dividend date, a new news story or corporate action.
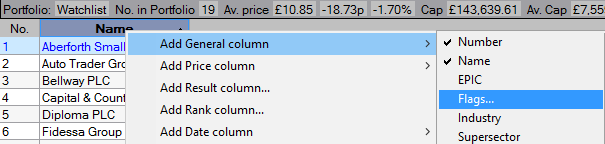
To display Flags to the left of the Name column, right-click on the Name column heading, select Add General column and then Flags... from the sub-menu.
The Add flags column dialog displays the available options:

In this example, let's add the following:
News Indicator (N):
- Unread stories today
Ex-dividend Indicator (x):
- Shares with an ex-dividend date Today (equities in the UK normally go Ex-div on a Thursday)
- Check forward 14 days - i.e. the ex-dividend is within the next 14 days
- Display indicator until payment date - the flag will display whilst the share is trading Ex-div
In a bid situation (B):
This shows if a share is currently the subject of a bid situation. For example, at the time of writing, Sainsbury is attempting to buy Home Retail Group, and so is flagged as a B in the example below.

Hovering the mouse over an X flag shows the ex-div date, dividend amount and date of payment.
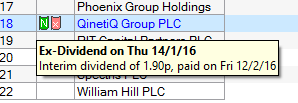
You can also hover over other flags to view more detailed information.
If you double-click on the News flag, it will display the most recent new story for that share. You can use the << Previous and Next >> buttons to navigate to other stories in the specified time frame. The News flag will disappear once all stories have been read.
EPIC (TIDM)
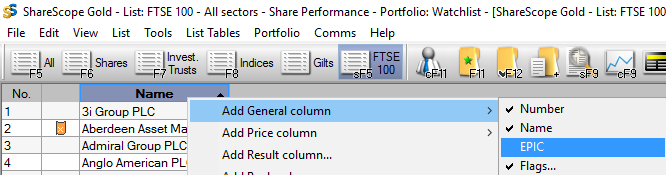
To add an EPIC column in-between the Flags and Name column, right-click on the Name column heading, select Add General column and choose EPIC from the sub-menu (note that new columns are always added to the left of the selected column).
EPICs are named after the London Stock Exchange's Exchange Price Information Computer.
They were renamed to TIDM (Tradable Instrument Display Mnemonics) in the 1990s. However, EPIC has remained the more popular of the two acronyms.
In the United States, they are generally known as a company Ticker.
To change the name of a column, right- click on the column heading and select Change heading... from the menu.

This will open a dialog box allowing you to rename the column.

You can also see the Default name and a Default button to revert to the original heading, if required.
Close price
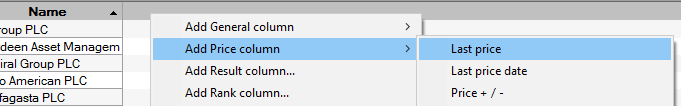
To add the latest close price, right-click on the grey bar to the right of the Name column heading. Select Add Price column and then Last price from the top of the sub-menu.
The new column now appears on the right-hand side of the table:

The Close column is, by default, set to dynamically decide whether to show the price in pounds or pence (if GBP) based on the value of the share.
If you prefer to use the same currency denominations, right-click on the column heading and select Numeric display...
You can change the Dynamic Pounds/Pence option to Pence and deselect the Show currency symbol option.
Price percentage change
Let's now add a couple of price percentage columns to see how the shares have performed over different timeframes. In this example, we'll look at both the daily change and change over the previous 12 months.
For the daily change, right click on the grey bar to the right of the Close column and select Add Price Column followed by % Price + / -.
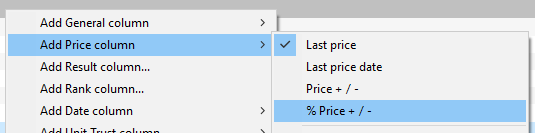
To add a column showing the price change over 12 months, right-click on the grey bar, select Add Price column and then Price change since...
This will display the following dialog:

Here, you can select whether you want to display the price change from a specific date or for a given period of time. You can also choose to return the result as an Absolute change, a Percent change or an Annualised % change.
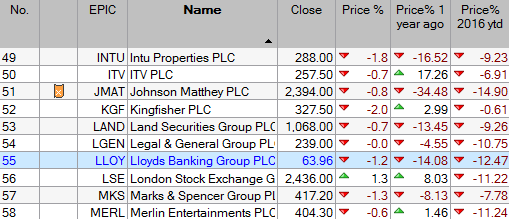
Select 1 year ago and Percent. Press OK to confirm or Add Now... to add further columns.

To display the percentage change for the year to date, choose either Year to date (since 31 Dec) for the financial year or Year to date (since 6 April) for the tax year.
Price/Earnings ratio
The PE ratio is one method of measuring the value of share (for more about using PE, click here).
The Add General column menu includes the following PE metrics:
- PE - Historical
- PE - Rolling 1
- PE - Rolling 2
- PE - Forecast
- PE - 12 month trailing
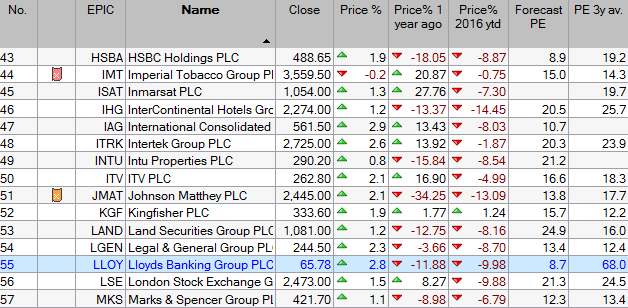
Let's start by adding the Forecast PE, which gives an indication of the value of share based on the expected earnings of the company.
You may also want to look at the average historical PE figures as a means of comparison. To do so, right-click on the grey bar and select Add Result column...

This will display the Add a result column dialog. Click on the Ratios tab and select PE ratio. Tick the Calculated box and select Average over 3 years:

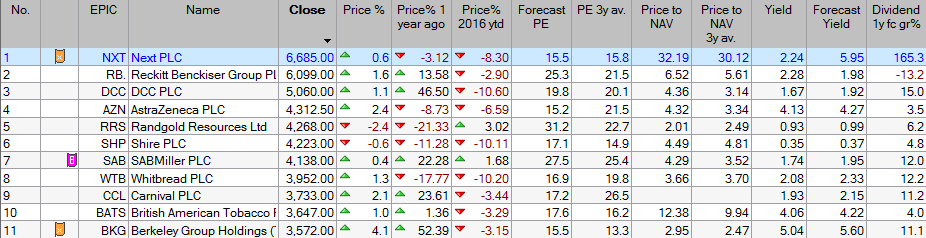
This is how the table looks so far:
Price to Net Asset Value
Net Asset Value (also known as NAV or Book Value) is another company valuation metric. The accompany Price to NAV looks at the share price relative to its value, and generally-speaking, a value of less than 1 indicates that a company is trading at a discount to its net asset value (click here for more information).
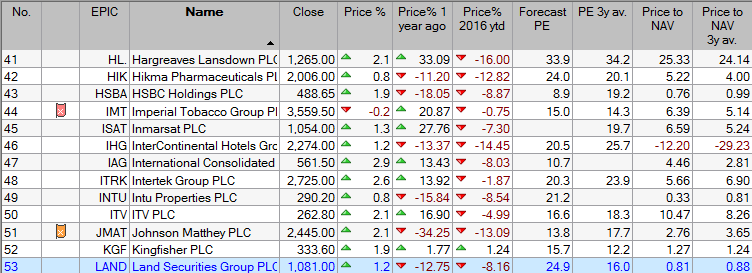
To add a Price to NAV, open the Add Result Column dialog, click on Balance Sheet tab and select NAV (Book value or Shareholder equity) from the list below. Under Additional Options, select Price to NAV:

As with the PE, you may want to compare the current value with an historical average
To do so, tick the Calculated option and select Average over 3 years.
Dividend yield
Let's now turn our attention to a share's dividend yield. The Add General column menu includes the following yield metrics:
- Yield - Historical
- Yield - Rolling 1
- Yield - Rolling 2
- Yield - Forecast
- Yield - 12 month trailing
We'll begin by adding Yield - Historical. This takes the dividend figure for the last financial year and divides it by the current price, giving a percentage figure.
For a comparison between the historical and forecast yield figures - i.e. whether yield is forecast to rise or fall - go to the Add Result Column dialog and select the Headline Results tab. Click Dividend, select the 1 year forecast; Calculated; Growth % over 1 year, as illustrated below:

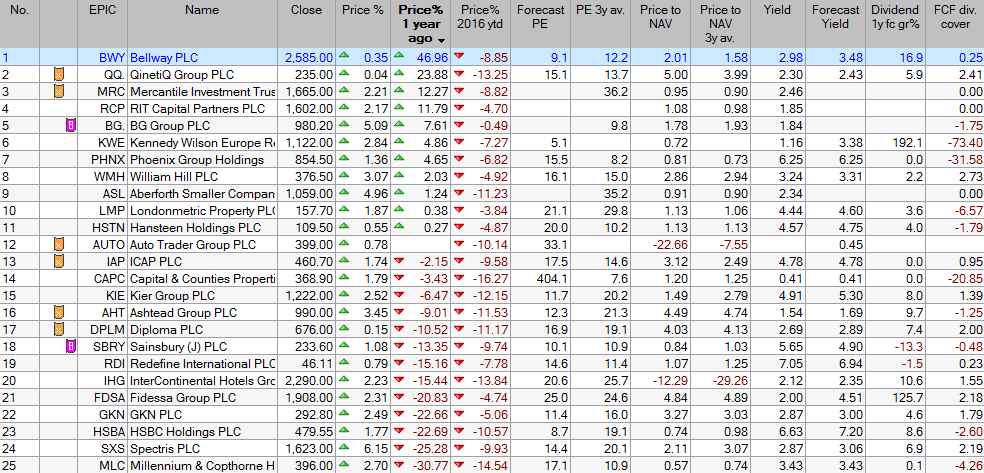
The table now appears as follows. Note how the latter column allows you to see, at-a-glance, shares with positive or negative yield growth.
Dividend cover
Dividend cover is a measure of company's ability to pay its dividends. In simple terms, a ratio of under 1 indicates that a company is paying more in dividends than it can actually afford (for more information, click here).
You can add Dividend cover via the Ratios tab of the Add a result column dialog:

An alternative to Dividend cover is Free Cash Flow (FCF) dividend cover (click here for a detailed explanation).
To display this measure, simply select FCF dividend cover under Additional options, as shown above.
Investment Trusts
ShareScope contains a series of columns dedicated to showing Investment Trust data. You can find these under the Add Investment Trust column option in the Add Column menu.

Note: ShareScope carries distinct columns for Equities, Investment Trusts, Unit Trusts and Gilts & Corporate Bonds. Some of these columns are only relevant to a particular type of instrument.
In this table, the following Investment Trust columns have been added:
- Premium/Discount to NAV
- Net dividend yield
You can also Add a Separator column... between equity-focused columns and investment trust columns to help differentiate the two.
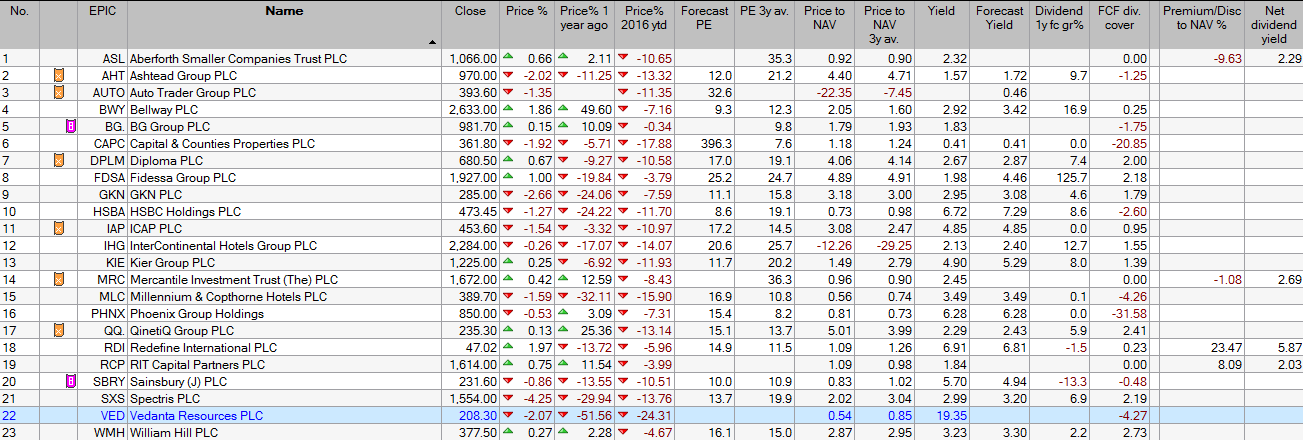
This table, now complete, can be used to look at a predefined list of instruments (e.g. FTSE 350), a watchlist or portfolio of shares in which you have a holding.