Tutorial: Directors' Dealings
In ShareScope you can click on Help and access a series of tutorials that give you an overview of the way the program works. This training zone article is designed to complement these tutorials, but also offer more detail than they are able to.
The Directors' Dealings View
You can select the Director's Dealings view by clicking on the green DD button on the main toolbar.

This view provides details about who owns the company.
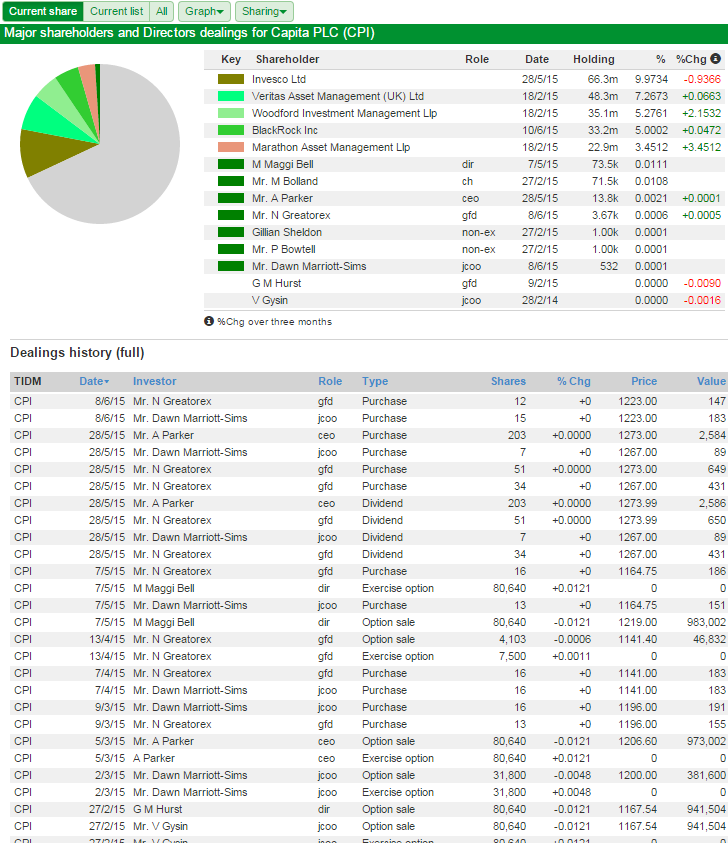
By default it shows details for the currently selected share. In the top part of the view is a Holdings chart and a table of the directors' and institutional holdings. Institutions (such as merchant banks and investment companies) have to declare holdings above 3% of the company's total number of shares.
The table also shows the change in holdings over the last three months which may indicate a change in sentiment towards the stock. If directors are buying when the share price is depressed, this may be a sign of confidence in the business. If institutions are selling it may be a sign that they consider the shares overvalued.You can see above that Marathon Asset Management LLP has recently acquired a holding of 3.4512% in Centrica. This would have required them to declare their interest via the RNS news service.
Below the chart is table showing the Dealings History.
Duplicate Holdings
Major shareholder and director holdings can be very difficult to identify when shares are owned through family trusts and other investment vehicles. Sometimes a holding may be recorded under a director's name and a company. Where such duplicates can be identified, both will be marked with a "d". Only the first entry will be included on the chart. In a small number of cases it is not possible to identify duplicate holdings which results in the holdings exceeding 100%.
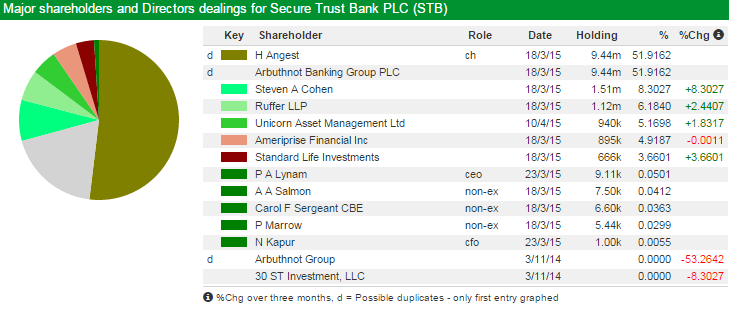
Here you can see H Angest, the Chairman of Secure Trust Bank PLC (STB), has a 51.9162% holding in the bank. You can also see Arbuthnot Banking Group PLC has an identical holding. So it is likely that the Chairman holds his stake in the bank via the Arbuthnot Banking Group.
The Chart
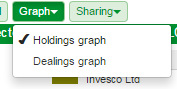
The Holdings graph can be changed to a Dealings graph by selecting the relevant option from the Graph menu.
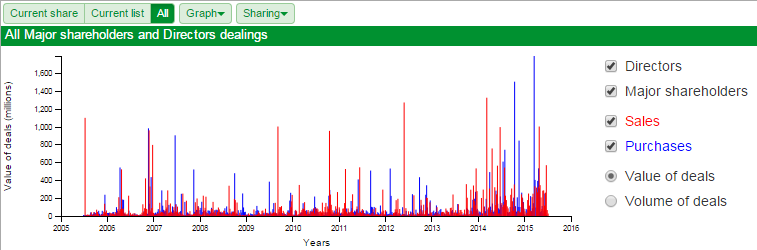
The Dealings graph shows the value and/or volume of director and shareholder dealings over time. It is possible to toggle either Directors or Major Holders or show both. In the same way it is also possible to toggle either Sales or Purchases or show both.
Current list and All
Instead of displaying details for the current share, you can display details for the current list (or portfolio or filter) or for all shares. If you select Current list, a table of dealings for all instruments in the list over the previous 31 days is displayed.
Note: The graphs do not show for the Current list option and only the Dealings graph shows for the All option.
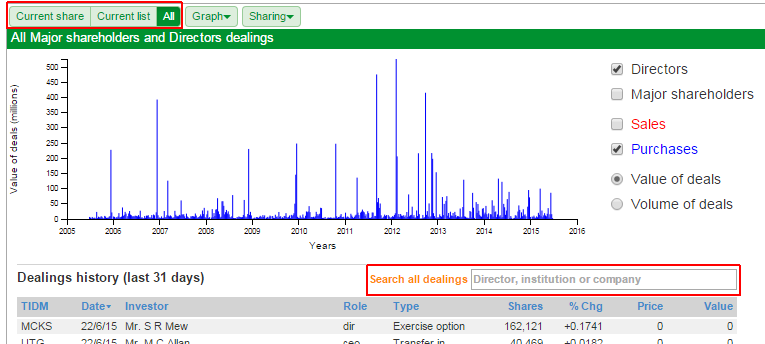
If you select All, a table of all dealings will be displayed. A search box enables you to search for individual directors, companies or institutions.