Tutorial: Fundamental Charts
This great feature enables you to chart financial data items. You might find it useful in one or more of the following ways:
- If you want to explore the relationships between data items (e.g. debt and returns) or between a data item and share price.
- If you want to compare a financial metric for a group of companies (e.g. a sector or portfolio).
- If you want to create a chart for a presentation (e.g. share clubs) or for publication (journalists).
Financial charts are customisable in terms of size, number of items, time period, colour, chart style, scale, axes and labels. You can export and print charts, post them to Twitter or share them with ShareScope Chat users. Here's an example chart created in the Financial Charts feature:
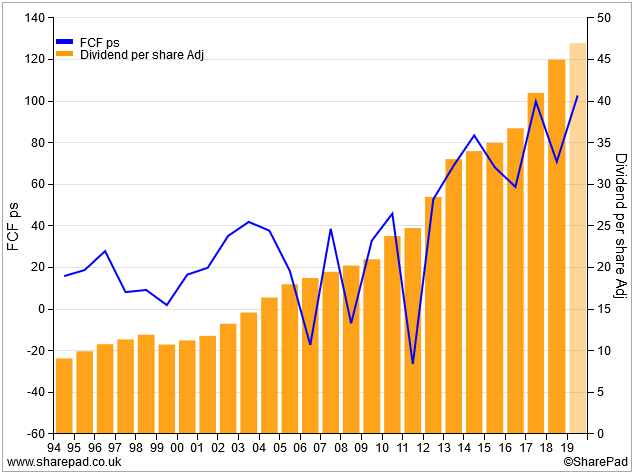
The Financial charts view
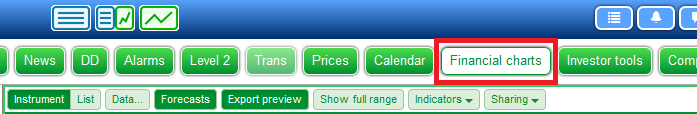
On wider screens, you will see a dedicated Financial charts button at the far right of the main toolbar:
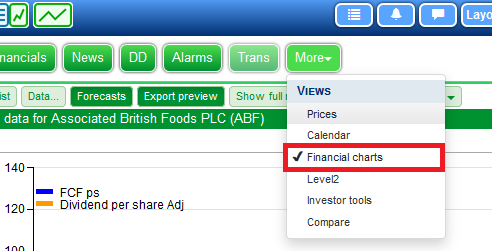
On narrower screens, you will see the More button which reveals a number of options including Financial charts:
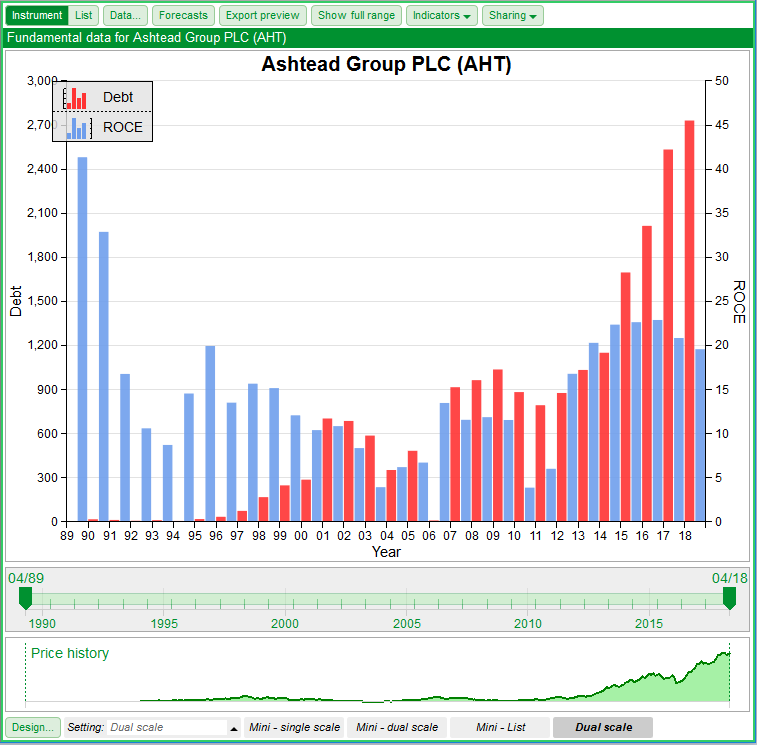
When you first access this view, one of the default settings will be displayed:
Step 1 - Understanding Settings
Settings can be thought of as templates which you can use, customise or copy. We've added six default settings but you can create more.
When you first display the Financial charts view, one of the default settings will be loaded. In the screenshot above, the setting Single scale is being used - you can see the name displayed in the Setting box in the toolbar at the bottom of the view. The Single scale setting displays a chart with two data items - Normalised EPS displayed as a line and Dividends per share displayed as bars. In this example, data for Interserve is displayed but in your copy of ShareScope it will be whichever instrument is currently selected in the List view.
To view or select the other default settings, click on the Settings box:
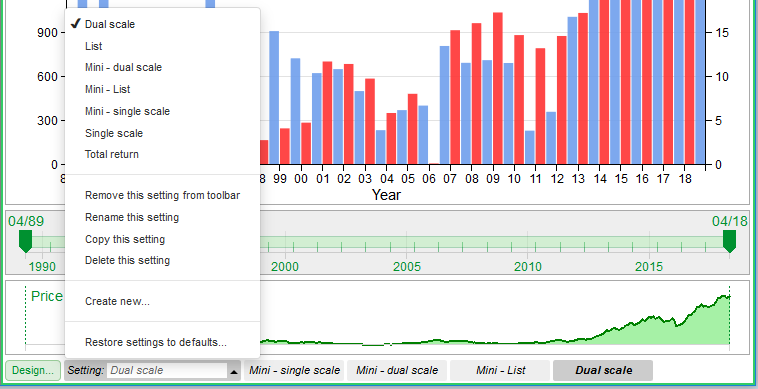
You can see all the options here for adding a new setting as well as copying, deleting and renaming settings.
There are five other default settings:
- Dual scale - two data items for the current share plotted on a dual scale chart. One item displayed as a bar chart, the other as a line chart.
- List - one data item charted for the companies in a list. This will default to the currently selected list in the List view. The chart can display a maximum of ten instruments so this mode is best suited for sectors or smaller portfolios.
- Mini - Single - a small chart designed for export it features a single data item for the current share displayed as a 10 year bar chart.
- Mini - Dual - another smaller chart for export, it plots two data items for the current share using dual axes.
- Mini - List - this chart plots a single item for the current list of shares.
We've also added buttons for these default chart settings along the bottom of the view. Simply click/press on them to change the setting.
Take a minute to look at each default setting to see if any of them could be used for the chart you want to create.
Note: you may just decide to use the same setting each time - customising it as required. Settings are useful if you are likely to use this feature regularly and create a number of different types of chart.
Step 2 - Choose a setting
To start creating a chart, you'll first need to decide which setting to use. You've got three choices:
- Use one of the default settings.
- If you'd like to preserve the defaults, use the Copy this setting option on the Settings menu to make a copy of any setting you want to use. You'll be able to give it a new name.
- Alternatively, use the New setting option to create a new one. You'll need to use the Rename this setting option to give it a relevant name.
Step 3 - Is this chart for a company or a list of companies?
You can create a chart showing financial data for a specific company (e.g. turnover for National Grid) or for a group of companies (e.g. operating margin for the housebuilding sector).
This is controlled by the Instrument and List buttons on the view toolbar:
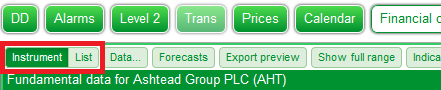
Make sure that the share or list (filter or portfolio) you require is displayed in the List view on the left of the screen.
In List mode, ShareScope will chart a maximum of ten instruments so bear this in mind when using filters and portfolios. Portfolios don't need to be the shares you hold; they can be used to create watchlists of instruments you are interested in.
Step 4 - What data item(s) do you want to include on the chart?
Now we're getting down to the nitty-gritty. To select or change the data items on the chart, click/press the Data button on the menu bar. The following dialog will be displayed:
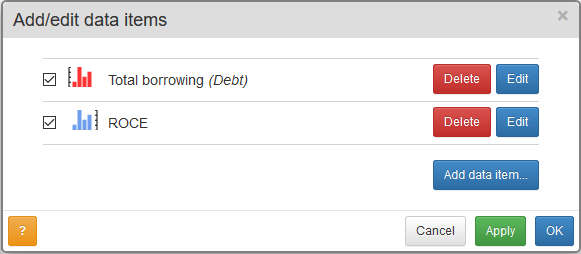
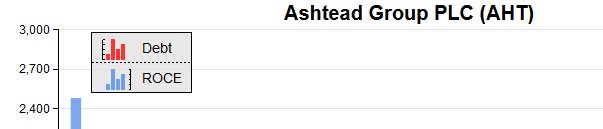
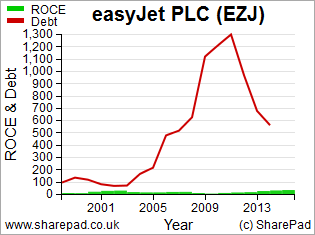
In this example, two items have already been added. The symbol next to the name of each data item shows you how they will be displayed. Here, the Total borrowing item is configured as a black line chart and uses the left hand Y axis. A custom name - Debt - has been entered and this will be displayed on the chart. The ROCE data item is configured as a green bar chart which uses the right-hand Y axis.
In this dialog, you can:
- Add another item by clicking on the Add data item button (see screenshot below).
- Delete items using the Delete buttons.
- Change items, or edit how items will be displayed, using the Edit buttons.
- Temporarily disable an item by unticking the box next its name.
Using the Add data item button or the Edit buttons will display the same dialog box:
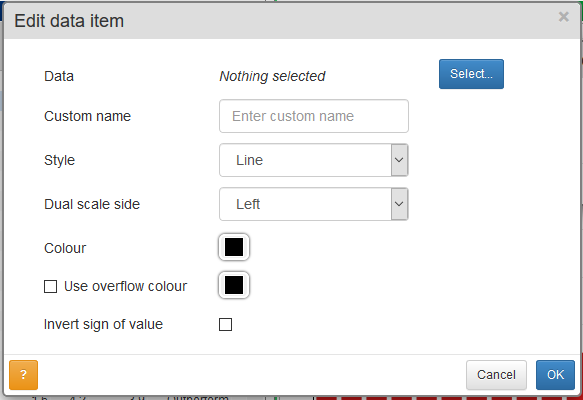
Edit as required.
Note that if you select to use both left and right hand Y axes, you will need to make sure that the Dual axes option is selected in the Design dialog (see Step 5).
Once you have chosen the data items to chart, you can adjust the timeframe by using the sliders beneath the chart:

If you want to include forecast data on your chart, use the Forecasts button on the menu bar. This button toggles forecasts on and off. Note that forecast data is only available for certain data items.
One final point in this section: you can also change the chart type of each data item by clicking on the symbols in the legend:
Clicking on the symbol for each item will toggle between the four different chart types: line, bars, points, area.
Step 5 - Fine-tune your chart
Once you've selected the data items to appear on the chart you can fine-tune the look of the chart including the axes, grid, labels, title and legend (key).
Click on the Design button in the bottom left corner of the view. The Design dialog (below) has a number of tabs. You'll find a Help (?) button on each tab.
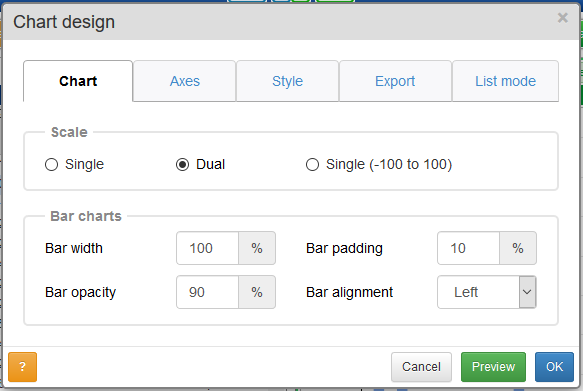
Edit as required. Note the Preview button which enables you to test changes without exiting the dialog.
See the final section of this tutorial for some useful features found in the Design dialog.
Step 6 - What do you want to do with your chart?
You may simply want to view your chart on the screen however you can also print, export and share charts. These options can be found on the Sharing button on the menu bar:
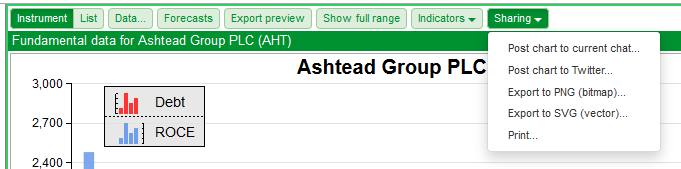
If posting a chart to Twitter, we recommend you use one of the smaller chart sizes. You can set this on the Export tab of the Design dialog - see previous section.
If you are exporting a chart to go into an electronic document, use the Export to PNG option. For publication in the press, use Export to SVG. Before exporting a chart, use the Export preview button on the menu bar to make sure it looks as required.
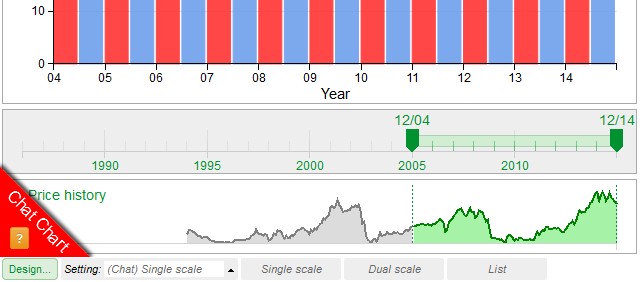
If posting a chart to the current Chat room, make sure you are in the desired chat room first. A link will be posted to the chat room. When another user clicks on the link, their copy of ShareScope will change to the Financial Charts view and display the chart you have posted. A red flash in the bottom left of the view will indicate that this is a "Chat Chart". A new setting will be created using the name of your setting with (Chat) appended to the front. The user may choose to copy and rename this setting. Chat settings are deleted as soon as the user changes share or logs out.
Some useful features
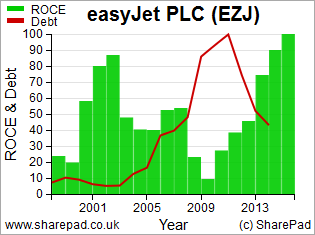
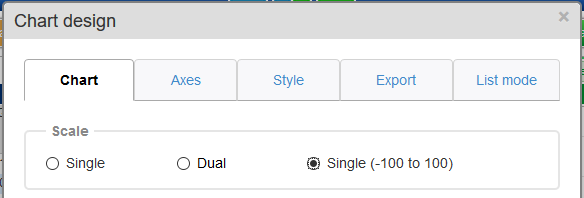
If charting two items with significantly different data ranges on a single scale, you may prefer to use the third of the scale options - Single (-100 to 100). Here, the Y scale will be calibrated from 0 to 100 and/or -100 as required. For each data item, the value furthest from 0 will be set to 100 or -100 and the other values in the range calibrated accordingly.
You'll find the scale options on the Chart tab of the Design dialog:
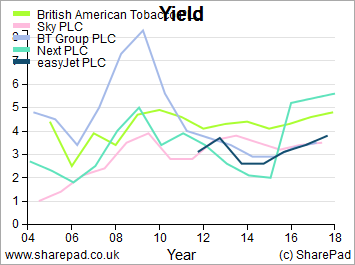
When charting a list of items, the legend can become too large. This can be particularly true on small chart sizes. To save space, you can choose to use the TIDM (EPIC) for each share instead of the full name. Note that when exporting charts, the legend loses the chart type symbol for each item and instead displays a coloured line.
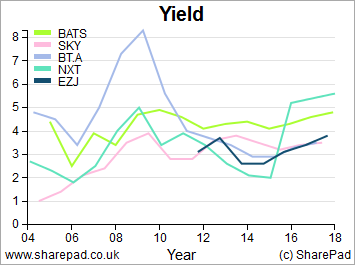
You'll find this option in the Legend panel on the Style tab.
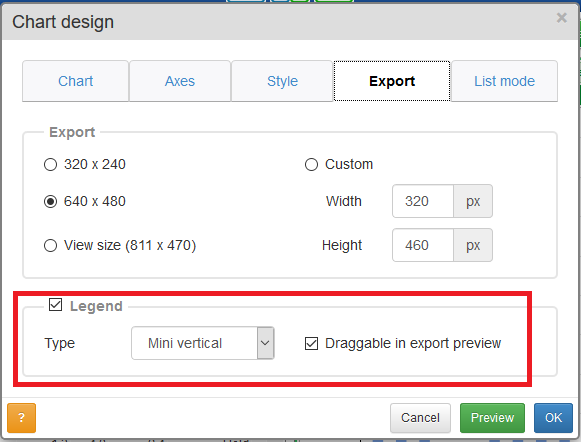
When exporting a chart you can also choose a horizontal rather than vertical legend. Note that you can also drag the legend to a new position in Export preview mode.
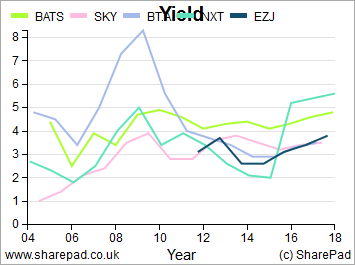
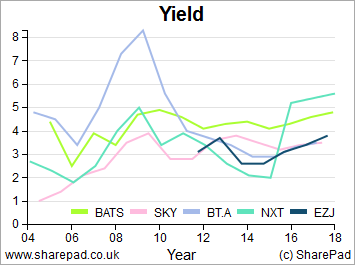
You'll find these options on the Export tab of the Design dialog:
For further help with the Financial charts feature, please don't hesitate to call the Customer Support team on 020 7749 8555.