The Compare view
ShareScope's Compare view is designed to allow you to compare and rank up to 20 shares using a range of financial data.
The ranking in the Compare view is designed simply as a visual guide to the stocks ranked highest in the various categories. No weighting is applied. Note: these are not stock recommendations.
A Compare button is located on the green toolbar.

On smaller screens, the Compare view option may be located by first clicking on the More button.

Adding shares to the Compare view
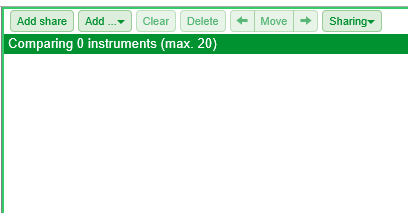
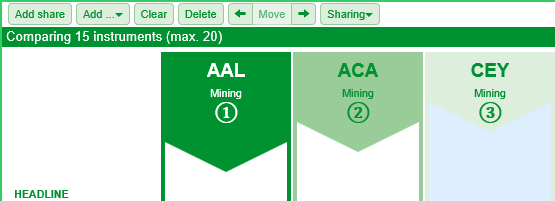
When you first open the Compare view, you will be presented by a blank screen with a title bar, which reads: Comparing 0 instruments (max. 20)
There are three ways to add shares to the Compare view.
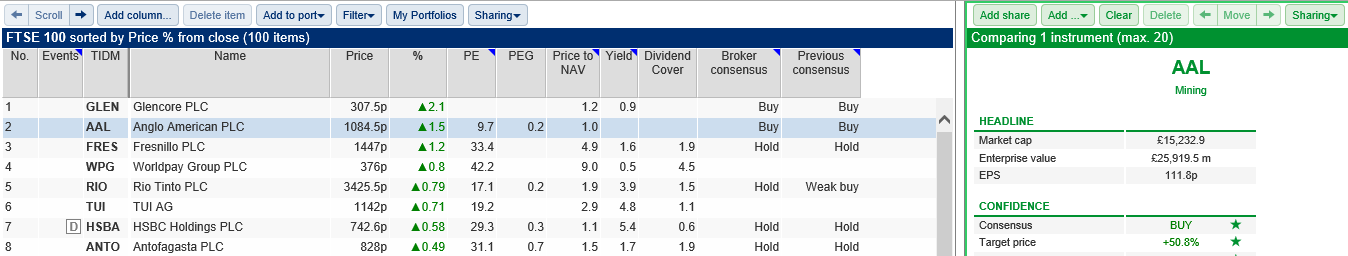
Method 1:
- Select a share from the a blue screen list (typically located on the left-hand side of the screen).
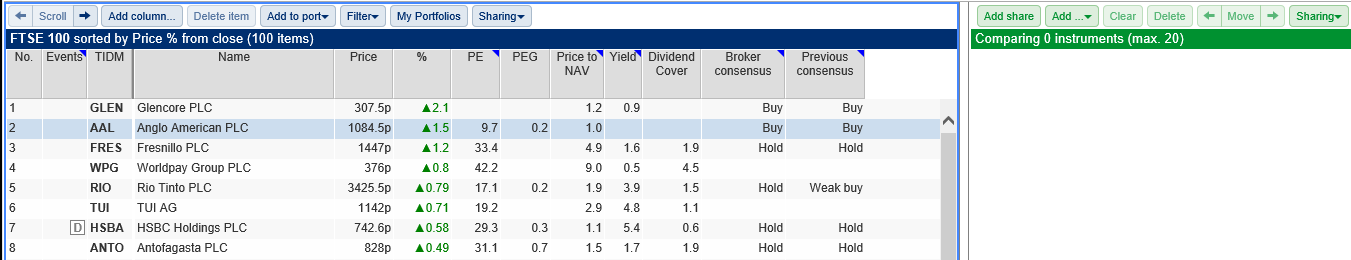
- Then click on Add share.

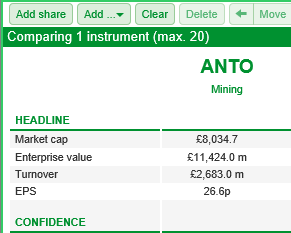
- The share will then be added to the Compare view.
Method 2:
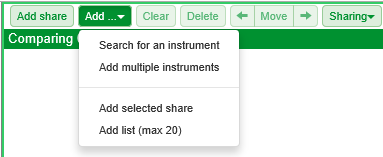
- Click on the Add... button and then select Search for an instrument.
- Enter the Name, TIDM (Ticker/EPIC), ISIN or SEDOL for the share you are looking for.
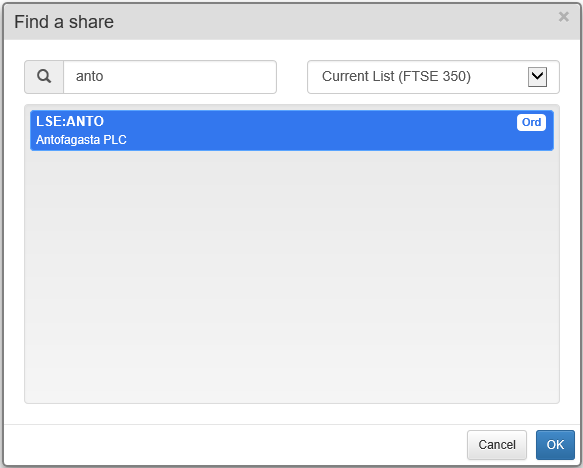
- If you are unable to locate the share you are interested in, click on the drop-down menu and select All (or the list that will contain the share).
- Once you have located the correct share, click on OK to add it to the Compare view.
Method 3:
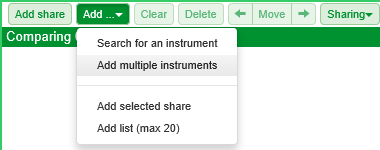
- Click on the Add... button and then select Add multiple instruments.
- You can enter the TIDM, ISIN or SEDOL code for each instrument you wish to add. You can also add the codes either as a list, separated by comas, or as a combination of the two.
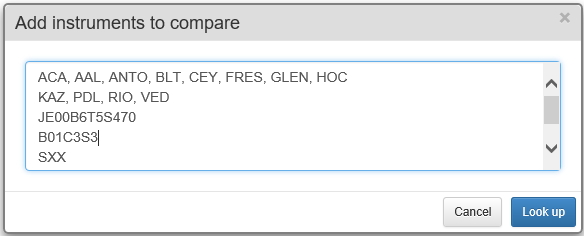
- Once you have entered your list click on the Look up button.
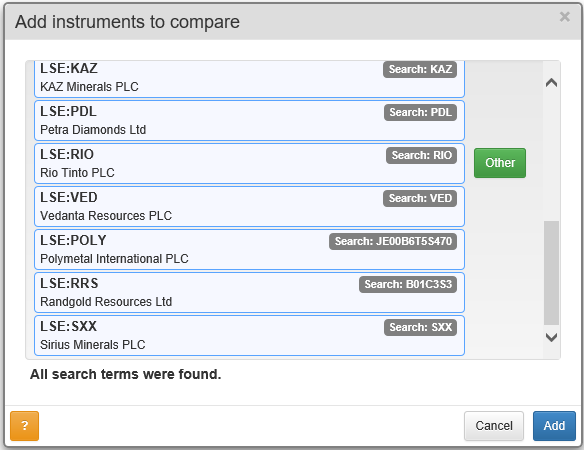
- You can see that Polymetal International PLC has been found using its ISIN code and Rangold Resources Ltd has been found using its SEDOL code. In addition to this an alternative instrument with the TIDM:RIO has been located. This is indicated by the presence of the green Other button
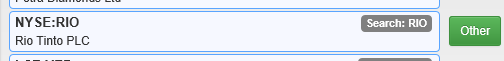
- If you click on the Other button the instrument will be changed to the alternative listing. In this case that is Rio Tinto's listing on the NYSE. Clicking on the Other button again will change back to the original selection.
- When you are happy with the list of shares to be added to the Compare view click on the blue Add button. All of the instruments will then be added to the Compare view.
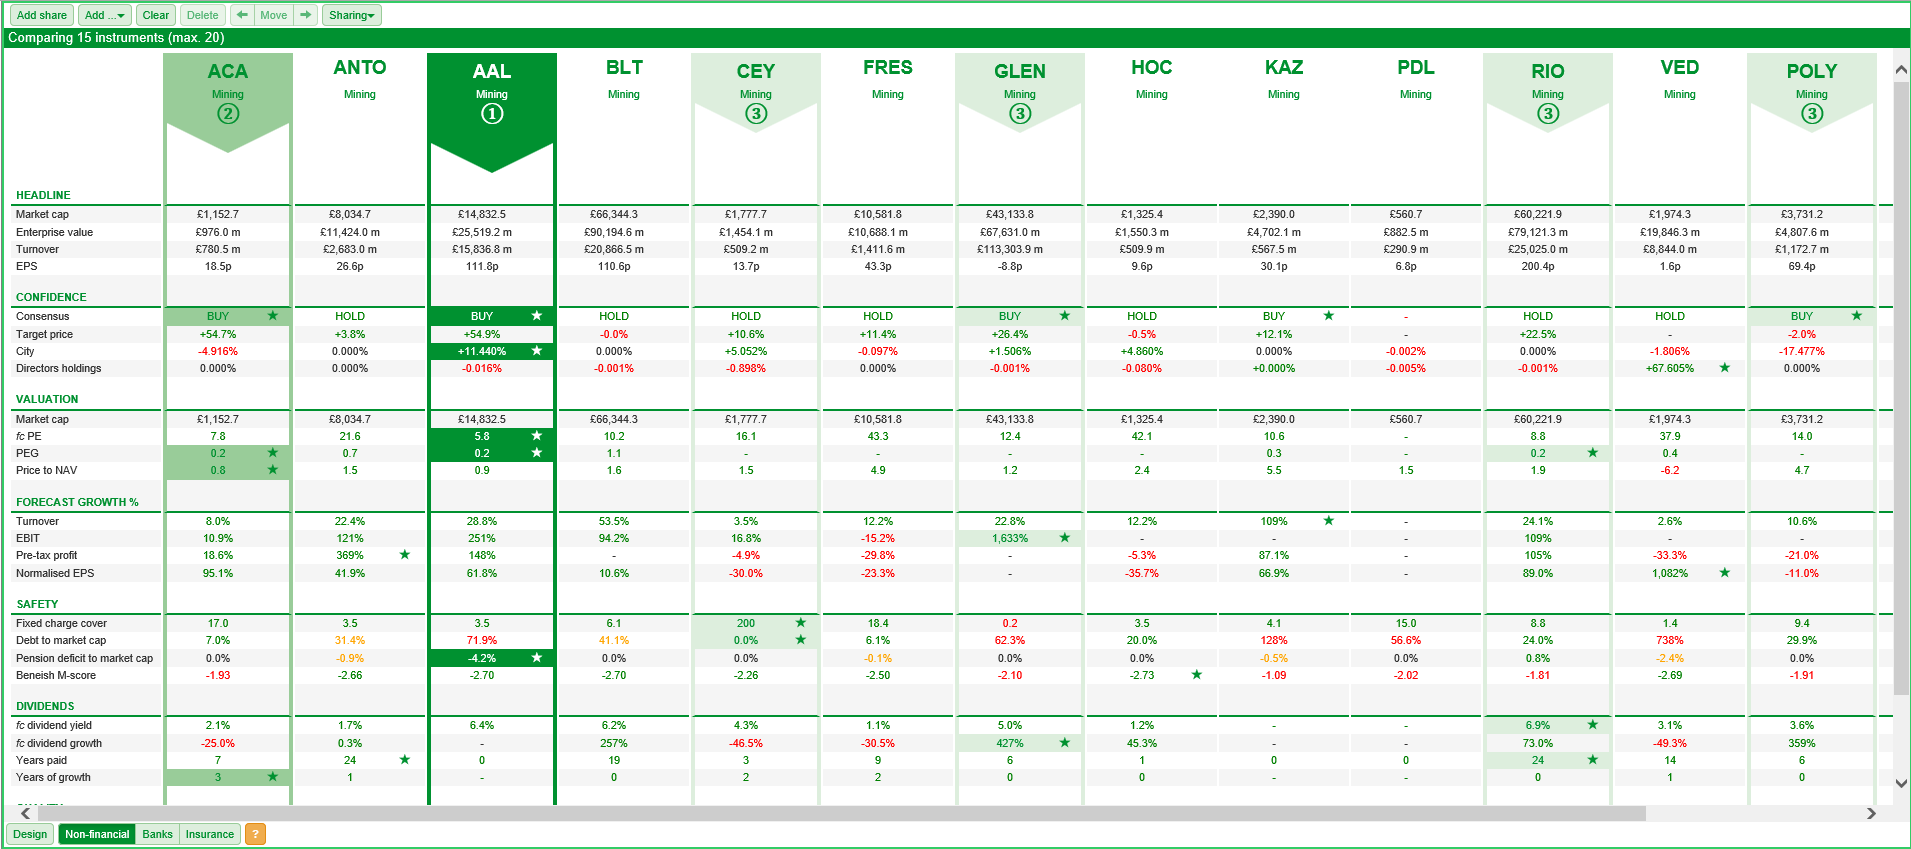
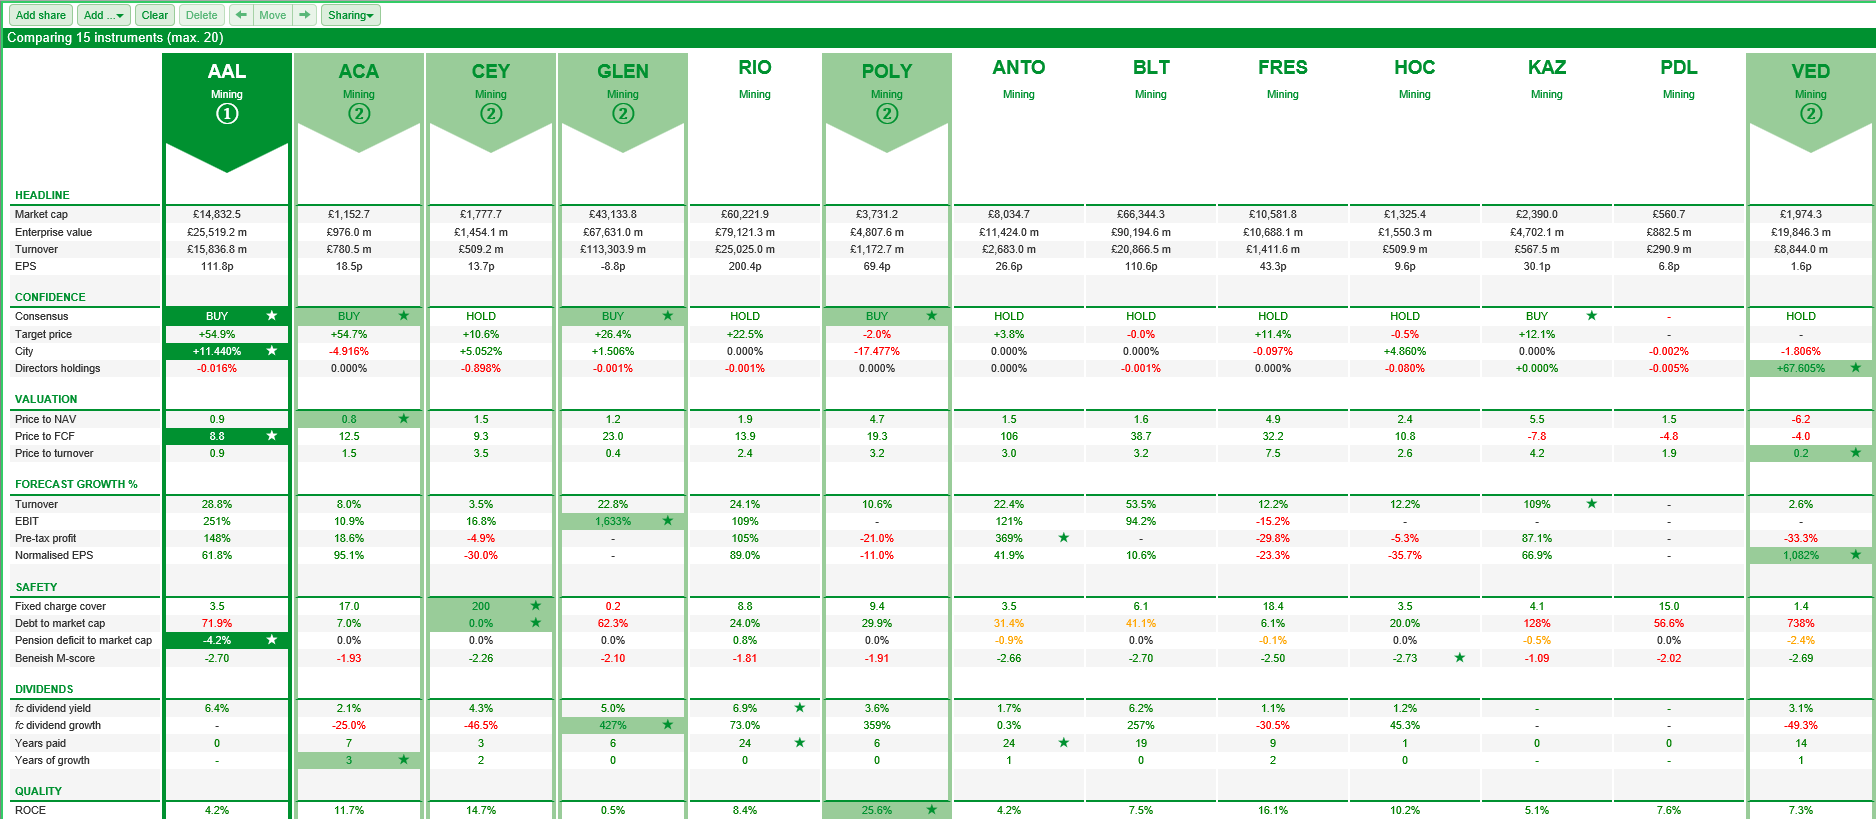
Share Ranking
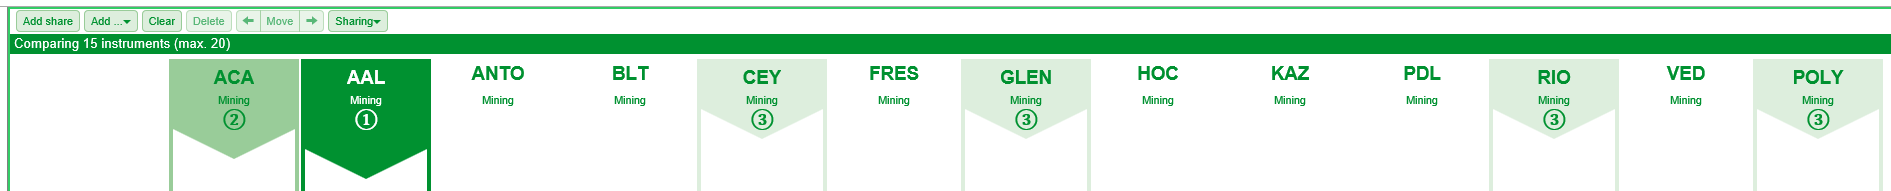
Once you have added all of the instruments you wish to add, they will be compare to one another on a range of financial metrics. The best performing share in each category is given a star.

The top three shares are then ranked based on the number of stars they have received. If multiple shares have received the same number of stars they are awarded the same rank.
Editing and rearranging the Compare view
You can select the column for individual shares by clicking anywhere in that column. The selected column will be highlighted in blue.
You can remove shares by clicking on the Delete button or move their position using the left and right arrow button.
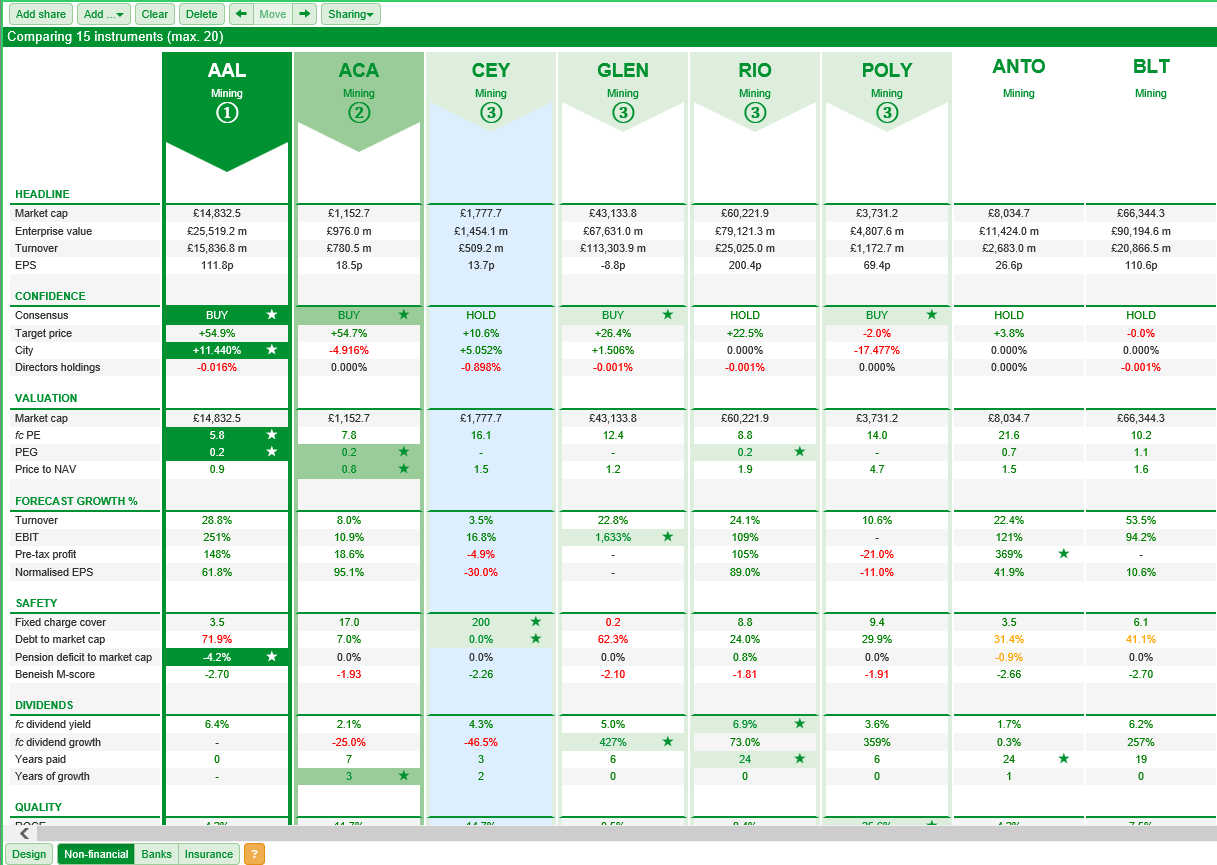
In the table above, the shares have been arranged according to rank.
If you wish to remove all of the shares you have added to the Compare view you can use the Clear button to do so.
Customising the Compare view
Like the Dashboard on the Summary screen in the Financials view the Compare view has template fundamental selections for Non-financial, Banks and Insurance.
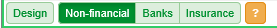
You can switch between these templates using the buttons at the bottom of the Compare view.
The Design button lets you customise what metrics are used for each of these three templates.
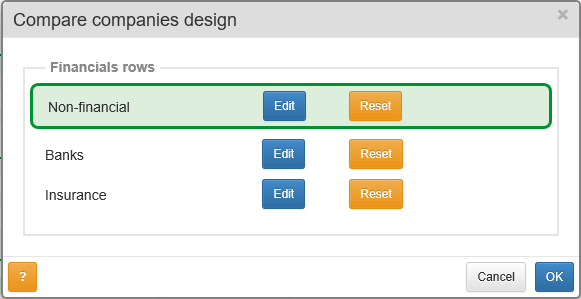
To change the metrics for one of the templates click on the appropriate blue EDIT button.
Each of the headline sections on the Compare view has a respective section in the Design dialog.
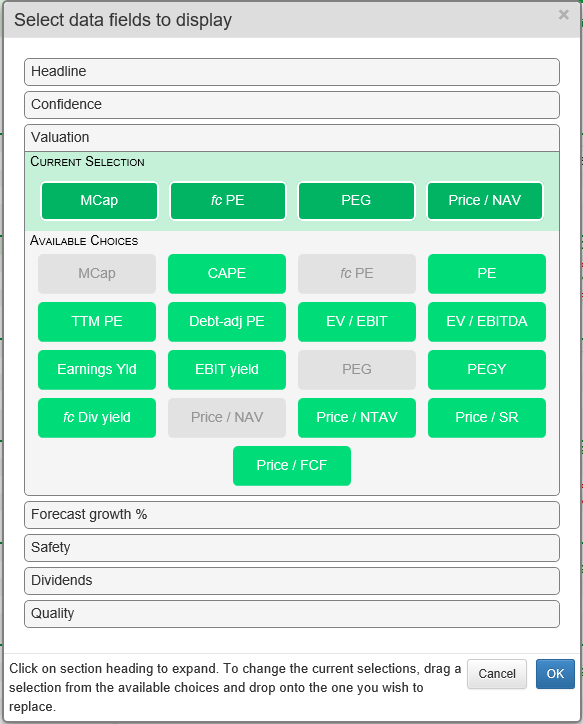
Click on one of the rows and it will expand to show current selected options and the alternative options available under that heading. You can then drag and drop up to four items from those available onto the Current Selection bar.
You can also remove items from the Current Selection bar and move them around on the bar.
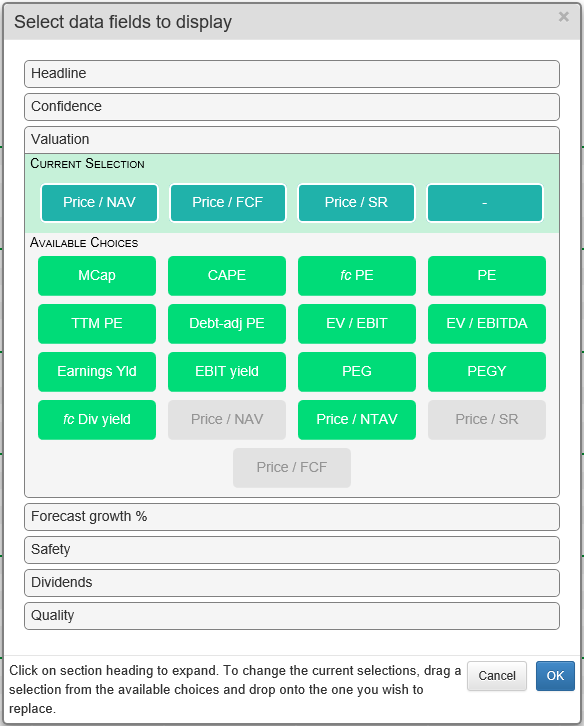
When you are happy with your changes click on OK.
If you change the chosen metrics then the rankings will also change on the Compare view.

The orange Reset buttons are provided so that you can set each of the different templates, Non-financial, Banks and Insurance back to their defaults.

ShareScope will ask you if you are sure before it resets the template for you.
Exporting and Printing
You can print the Compare view but selecting the Sharing button and then Print.
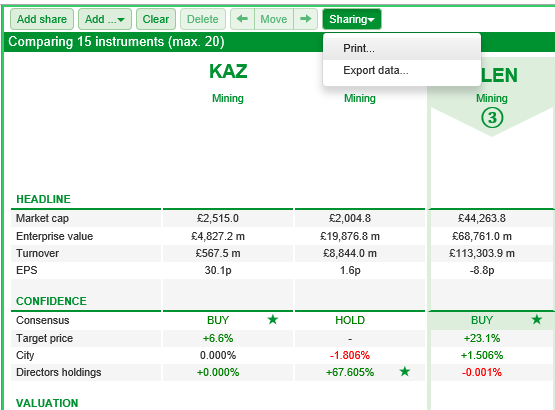
Note: Using the browser's print function may result in an error in the printing process.
You can also export the data. This will be saved as a .csv file in your Downloads folder and can then be opened in a Spreadsheet program like Excel, SCalc or Numbers.