Tutorial: Basic Chart Design
In ShareScope you can click on Help and access a series of tutorials that give you an overview of the way the program works. This training zone article is designed to complement these tutorials, but also offer more detail than they are able to.
In this article:
- Range of the chart and bar size
- Changing the range shown on the chart
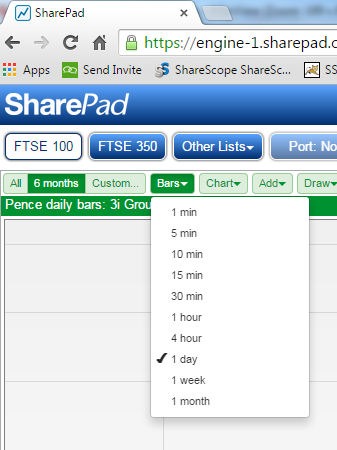
- Changing the size of the bars shown on the chart
- Changing the appearance of the chart
- Chart tab
- Background tab
- Volume tab
- Example chart
In this tutorial we are going to look how to change the design of your charts so that it will show the data in the way that you want it to.
For information about how to create new chart settings please have a look at the ShareScope Chart Settings tutorial.
Range of the chart and bar size
The default chart that is displayed when you create a new chart setting is set to show a 1 year chart with daily bars.
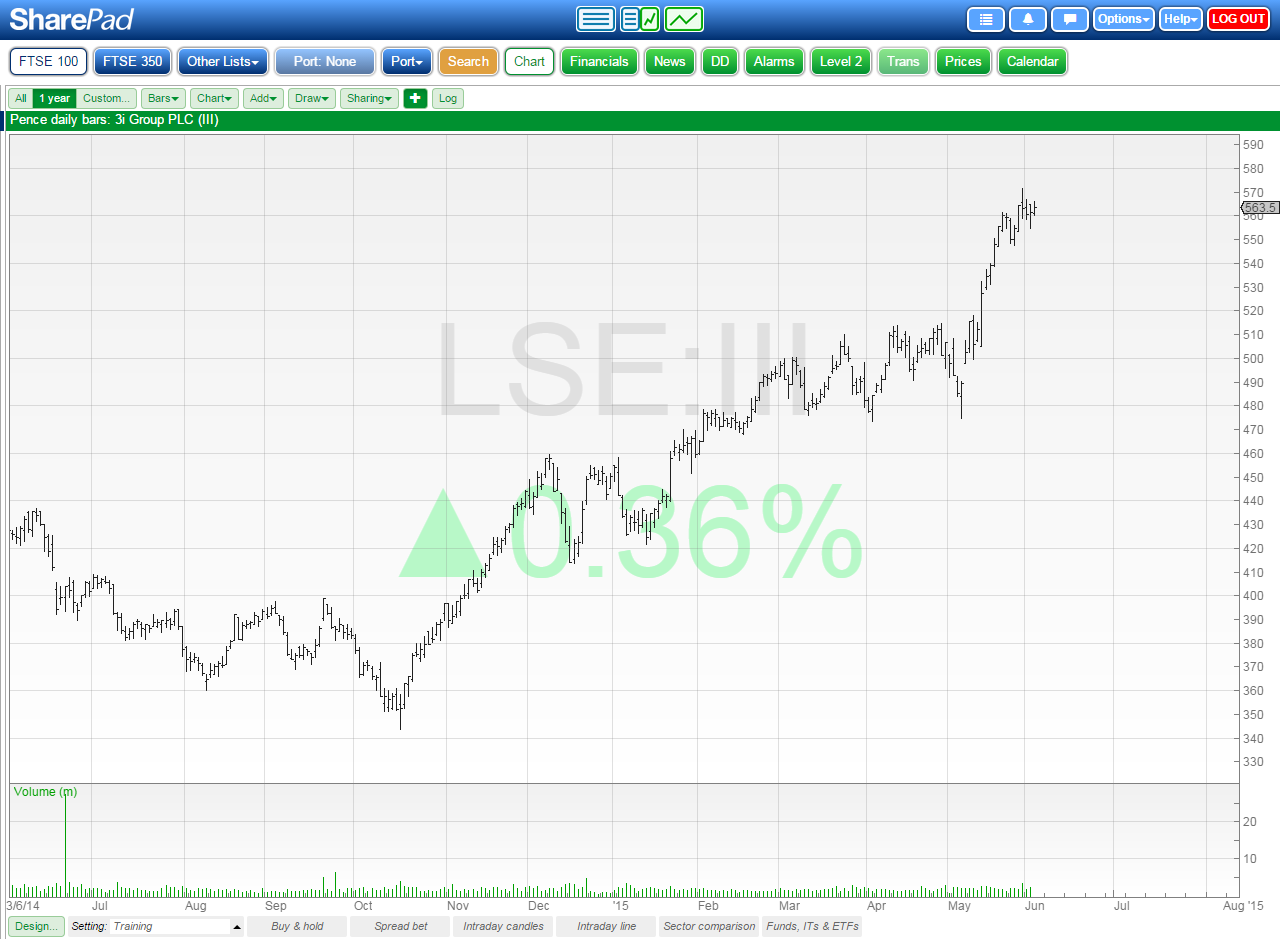
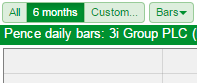
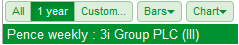
You can see what range and bar size a chart is set to by looking at the top left of the chart screen.
The first three buttons on the toolbar relate to the range shown on the chart. Here you can see 1 year is highlighted in dark green.
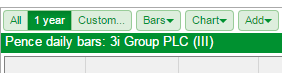
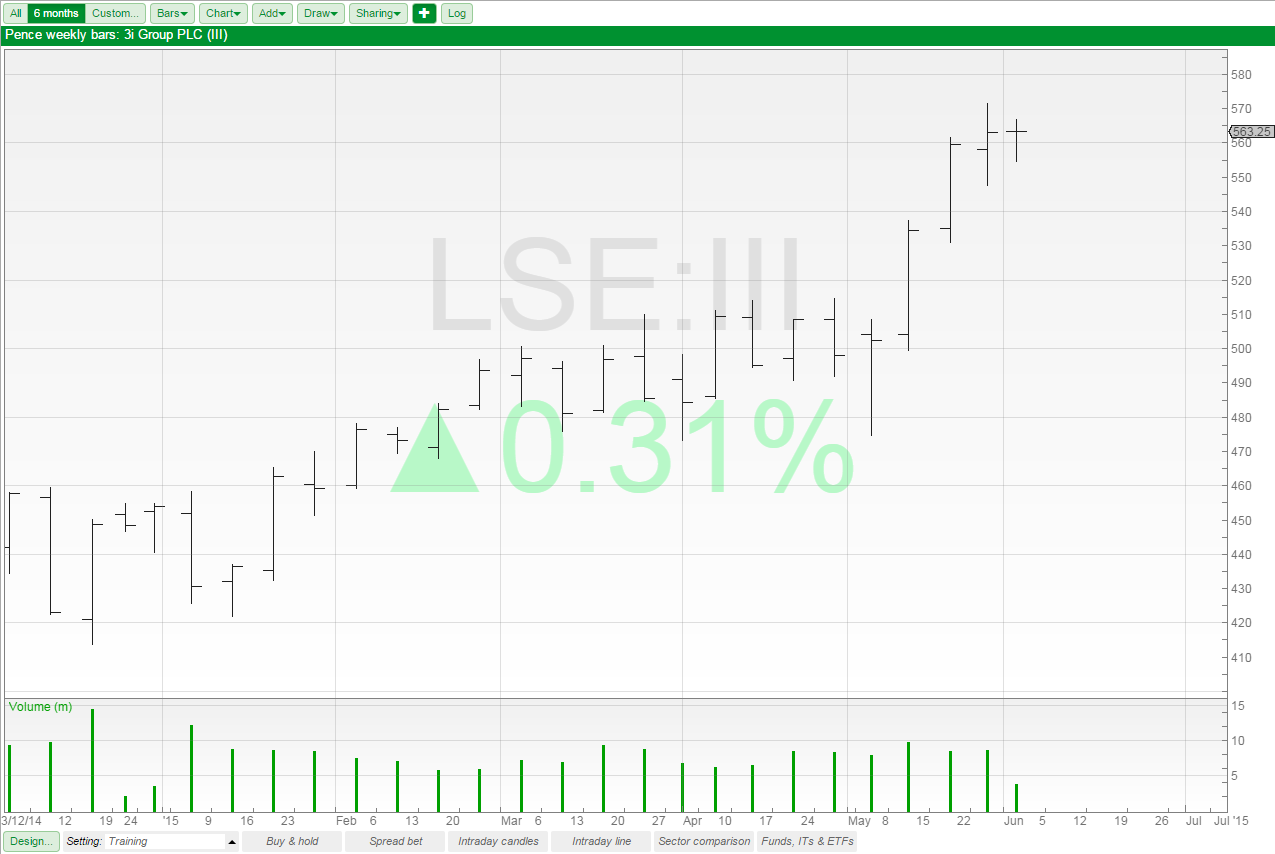
Below that on the title of the graph you can see: Pence daily bars: 3i Group PLC (III). This tells you the size of the bars being displayed on the chart.
Changing the range shown on the chart
To change the date range you can select the All option, which will show all of the data we have for the selected security.
You can select whatever is shown on the second button, in this case 1 year.
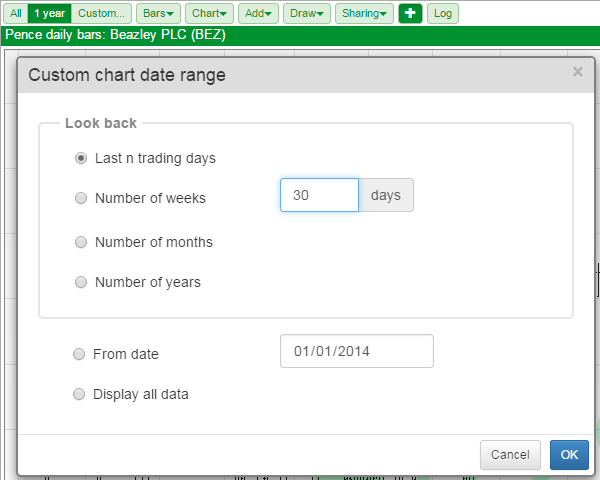
Or you can select the Custom... button which will open a dialog that allows you to set your preferred range.
Once you have set your options the button to the right of the All button will change to reflect this.
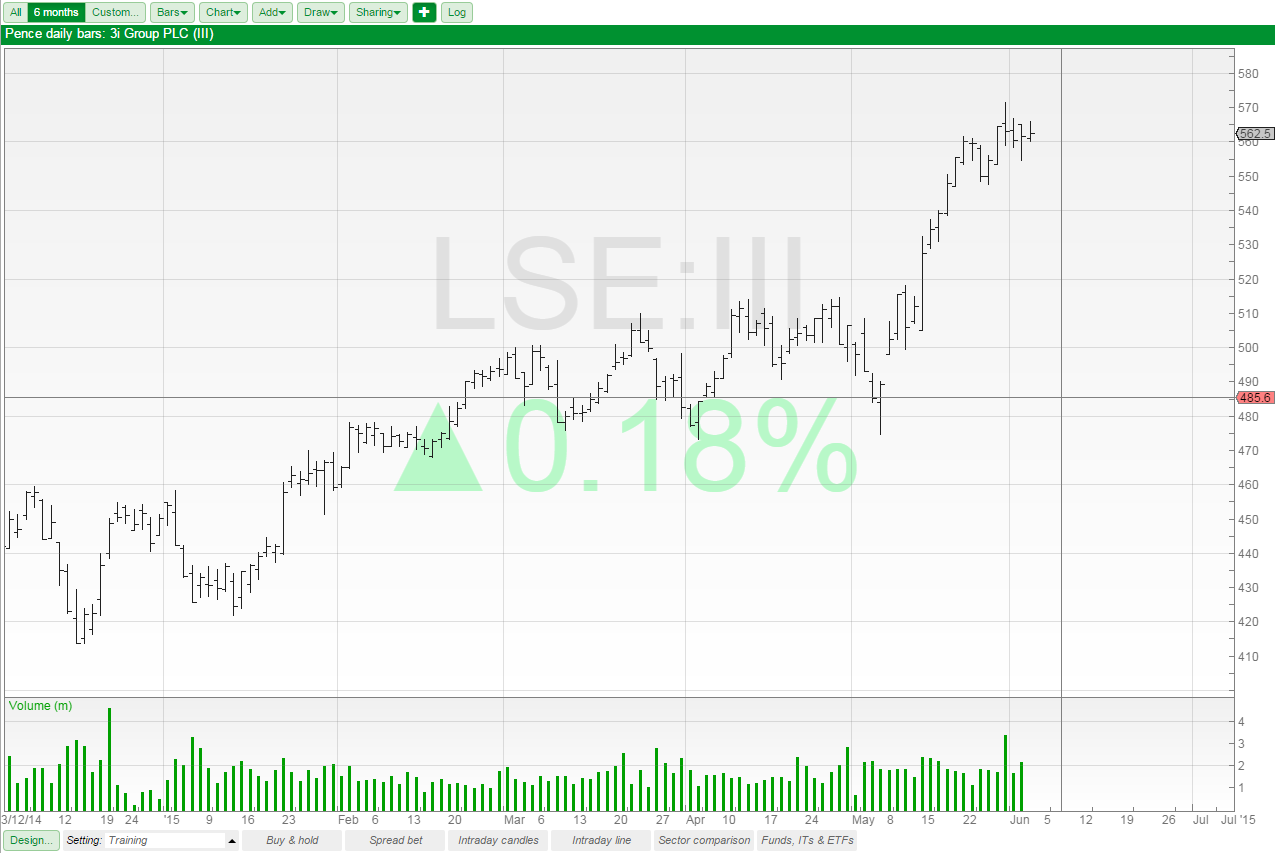
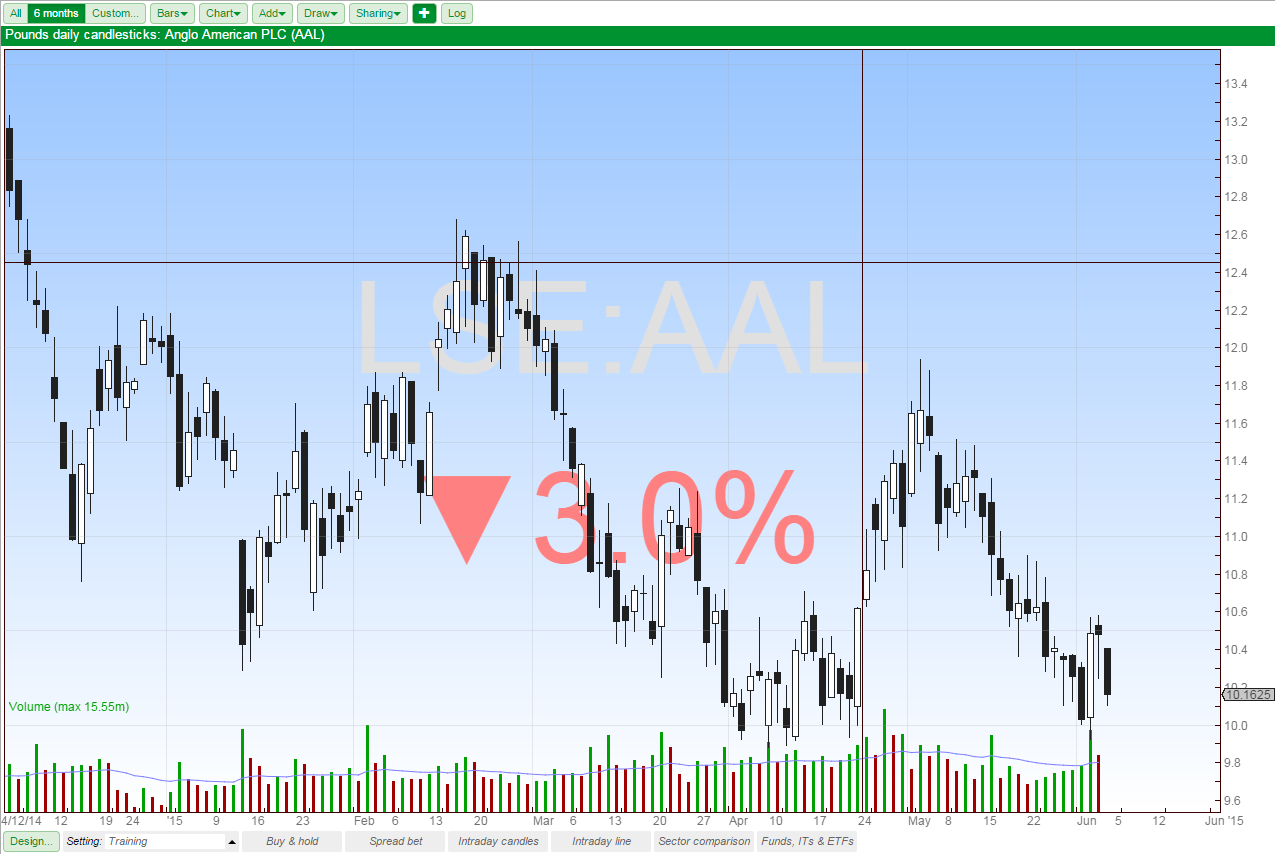
In this example we have set the range to be 6 months. You can see that the second button on the toolbar now reflects this.
Changing the appearance of the chart
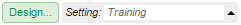
Many aspects of the chart can be changed by selected the Design... button which is located in the bottom left-hand corner of the chart.
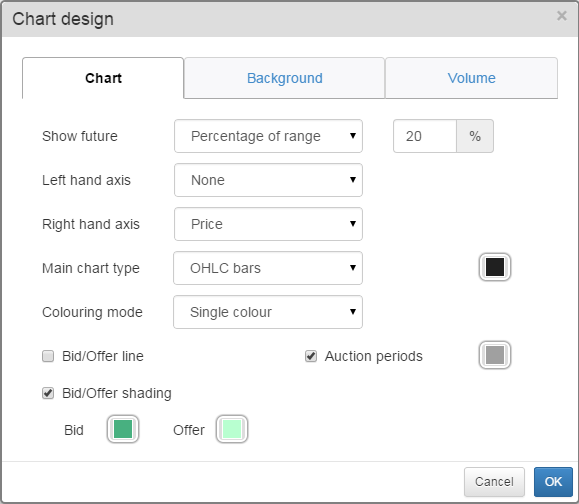
You can see that there are three tabs on the Chart design dialog window; Chart, Background and Volume.
Chart tab
On the Chart tab you have the following options:
Show Future - this determines how much blank space is shown on the chart between the latest candle and the right hand axis.
Left hand axis & Right hand axis - these allow you to change both axes so that they show either percentage or price values or they are turned off.
Main chart type - this allows the user to change the way the price data is shown on the chart. The current options are:
- None
- Mid Line
- Close Line
- OHLC bars
- Candlesticks
- Heikin-Ashi
Colouring mode - this allows the user to change the way the main chart type is coloured. The available options are:
- Single colour
- Close/Close
- Close/Open
When Close/Close or Close/Open are selected, up and down colours become available on the right hand side of the dialog screen.
Note: Colouring mode is only available when OHLC Bars, Candlesticks or Heikin-Ashi are selected as the Main chart type.
Bid/Offer line - this draws lines on the chart that show the share's Bid and Offer. The area between the two lines represents the Spread.
Bid/Offer shading - this shades the area above and below the Offer and the Bid on the chart. The offer will shade the upper portion of the chart and the Bid will shade the lower portion of the chart. As with the Bid/Offer line the area between the two coloured sections on the chart is the spread.
Auction periods - this shows a bar on the chart from the top of the chart to the Y axis for any period where a share has been placed in an unscheduled auction.
Note: Bid/Offer lines, Bid/Offer shading and Auction periods are only shown when the chart is set to show bars that are less than 1 day in size.
Background tab
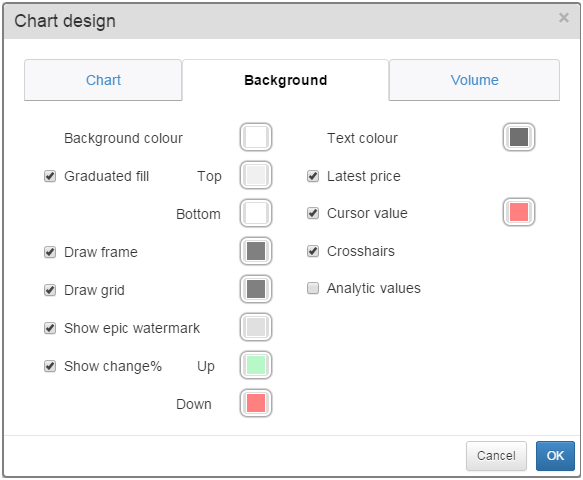
On the Background tab you have the following options:
Background colour - this determines the colour of the background of the chart and the area surrounding the axes.
Graduated fill: Top & Bottom - This sets a graduated colour fill from the top to the bottom of the chart.
Note: this overrides the Background colour for the chart, but only within the chart axes.
Draw frame - this turns the frame around the chart on and off and determines its colour.
Draw grid - this turns the grid on the chart on and off and also determines the colour of the lines.
Show TIDM watermark - this shows the selected share's TIDM (EPIC) code on the background of the chart.
Show change%: Up & Down - this shows the % change in the share's current Mid(or Close) price from the previous Close as on the background of the chart.
Text colour - changes the colour of the text on the axes of the chart.
Latest Price - show the latest price for the instrument in the right hand margin.
Cursor value - this shows the value of the cursor in the right hand margin and the date of the cursor above the Y-Axis at the bottom of the chart. The colour of the label used can also be set.
Note: the date only appears when a bar size of 1 day or greater has been selected.
Crosshairs - draws a horizontal and vertical line centred on the cursor.
Note: the colour of the crosshair lines is set by the Draw frame colour option.
Analytic values - shows the current value for any of the Moving Averages or Indicators in the right hand margin. The label will be coloured with the same colour as the main line for the indicator or the moving average.
Volume tab
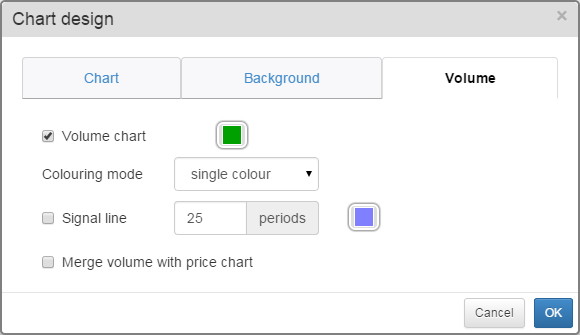
On the Volume tab you have the following options:
Volume Chart - this turns the volume on and off and sets the colour of the volume chart.
Colouring mode - this allows you to change the way the volume is coloured. The options are:
- Single colour
- Volume +/-
- Bar Close +/-
- Volume - signal
Note selecting any option other than Single colour will provide Positive and Negative colour options besides Volume chart.
Signal line - Allows you to draw an exponential moving average of the volume. You can set the period and colour of the line that is drawn.
Merge volume with price chart - In ShareScope, especially on smaller tablet screens, space can be of a premium. This option allows you to draw the volume over the bottom of the price chart. This then frees up space either for the chart or for an indicator.