The Holdings view
The Holdings view shows details of all the transactions you have recorded over the lifetime of your portfolio.
To access the Holdings view:
- To begin, select the appropriate portfolio using the blue Port button on the blue side of the screen.
- Once you have selected a portfolio, you will see that the dark green Trans button is selectable - clicking on this will open the Transactions view. Note that the Trans button will also turn white, indicating that this is the current view.
- From here you can click the pale green Holdings button.
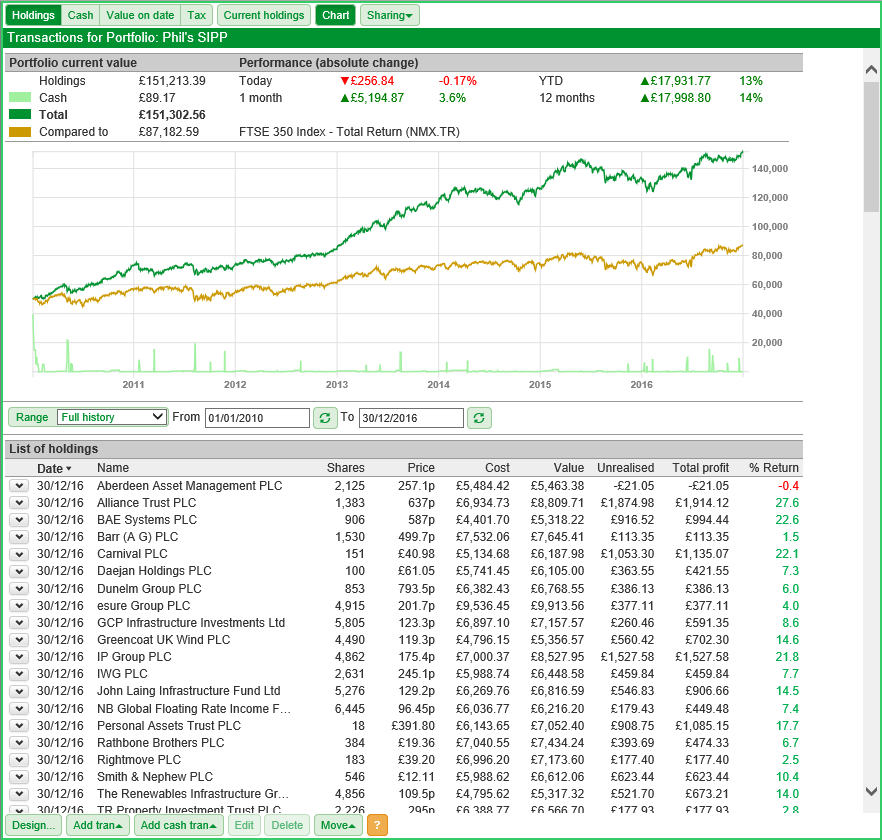
At the top of the Holdings view is a summary which shows the current value of the portfolio and the performance of the portfolio over various time periods.
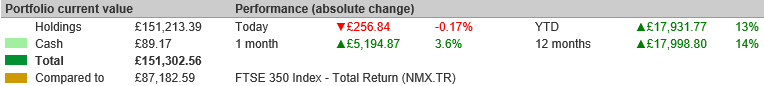
On the left-hand side, there is a breakdown of the value of the portfolio. It shows the value of the Holdings, Cash, and also the Total value.
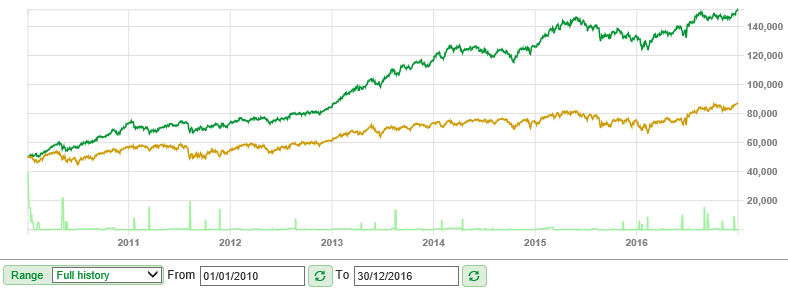
If you have selected to draw a comparative line on the chart, this will show how the investment would have performed had you invested your cash position into that instrument instead. In this example, you can see that the portfolio has strongly outperformed the FTSE 350 Total Return index.
Below the summary is a chart of the portfolio's performance. For more information about how to use the chart have a look at our tutorial here.
Below the chart the table of your holdings is shown.
By default, the latest position for each holding is shown in the table. These can be expanded to show all of the transactions relating to that instrument.
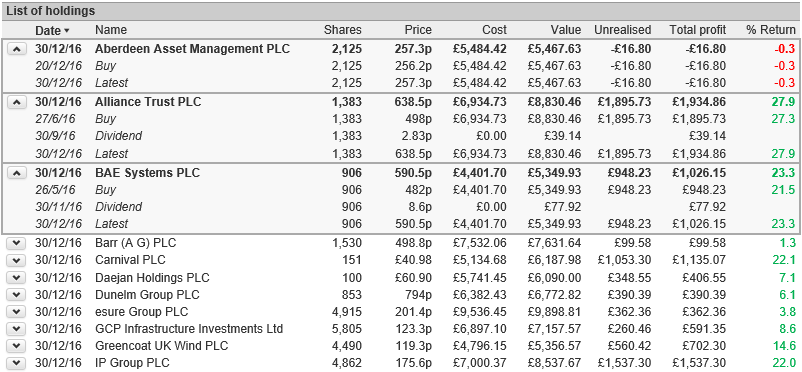
In the above image, the top three holdings have been expanded; each transaction recorded for that share is shown on a separate row.
Note: If you change view, for example to a Chart view and then return to the Trans view, any expanded transactions will be contracted. However, if you just change between the four views in the transaction screen - Holdings, Cash, Value on date or Tax - then the expanded transaction will remain expanded.
If you recorded transactions against enough shares over the life of your portfolio then a scroll bar on the right axis will be become available.
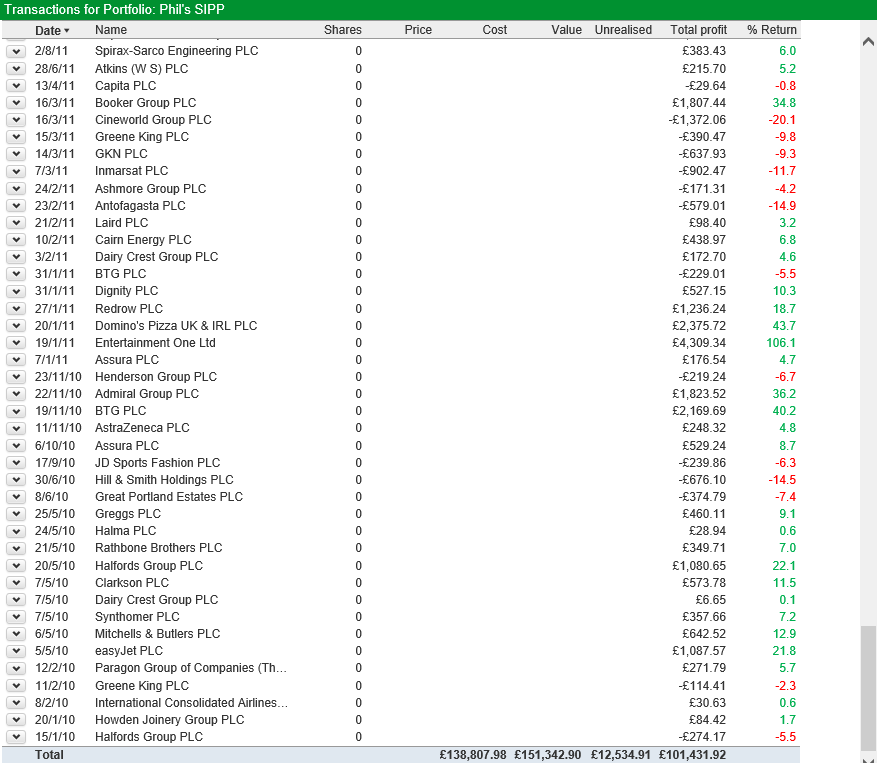
In the example above, the table has been scrolled to the bottom of the list of holdings and the summary and chart sections of the view have been scrolled off the page. However, the column headings for the table remain visible at the top of the screen.
All of the holdings shown here are closed positions in which no shares are held. Because of this the only information shown for those shares are the Total Profit and % Return figures.
At the bottom of the table you can see the Total line which shows the total cost, value, unrealised profit and profit figures for the portfolio.
You can opt to only view your current holdings (rather than a list of historical positions, no longer held) by clicking on the pale green Current Holdings button. The button will remain dark green whilst it is turned on.
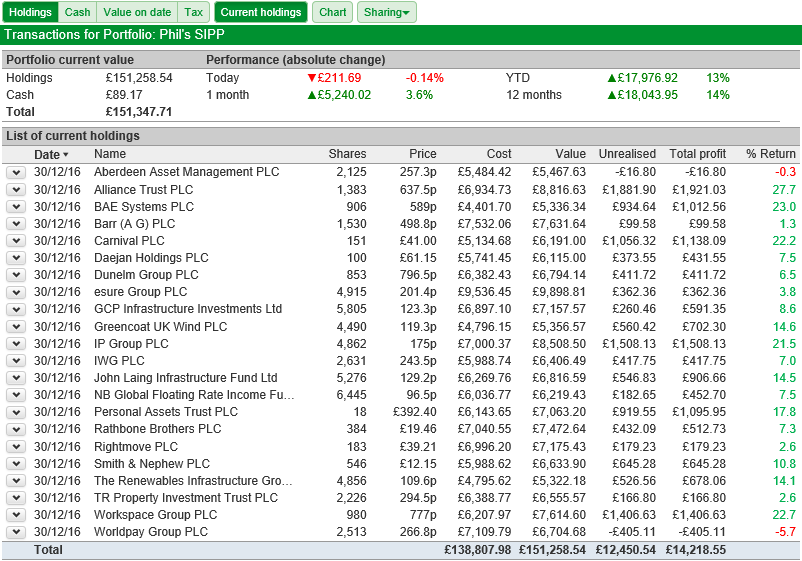
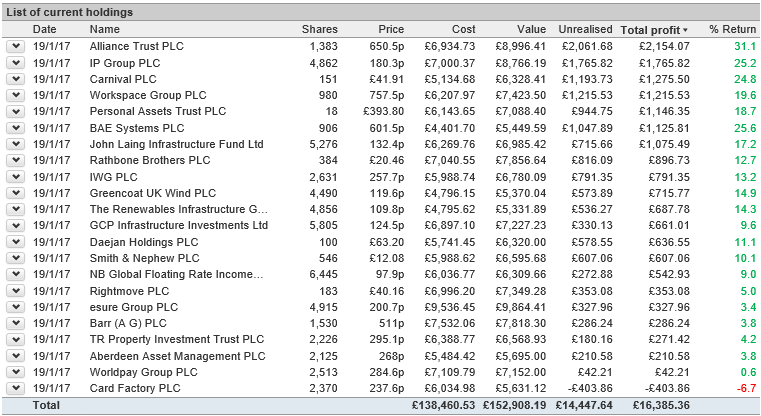
By selecting the Current Holdings button and deselecting the Chart button you can see that we are able to view the current position and performance of all of our current holdings.
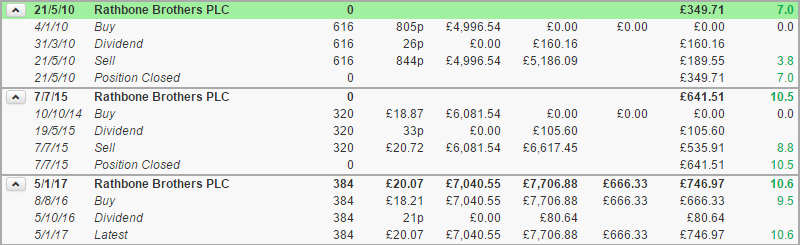
If you buy and sell a share, ShareScope will label the position as closed. Subsequent holdings in the share will be shown as separate entries in the Holdings table. Thus when Current holdings is selected, only the current position in the share, provided it has not been closed, will be shown in the table.
The Holdings table can be sorted by any of the visible columns simply by clicking on the column heading. So, for example, you may want to sort your holdings by Total profit to see which holdings are making the most money and which are not performing how you expected them to.
Clicking again on the same column will reverse the order.
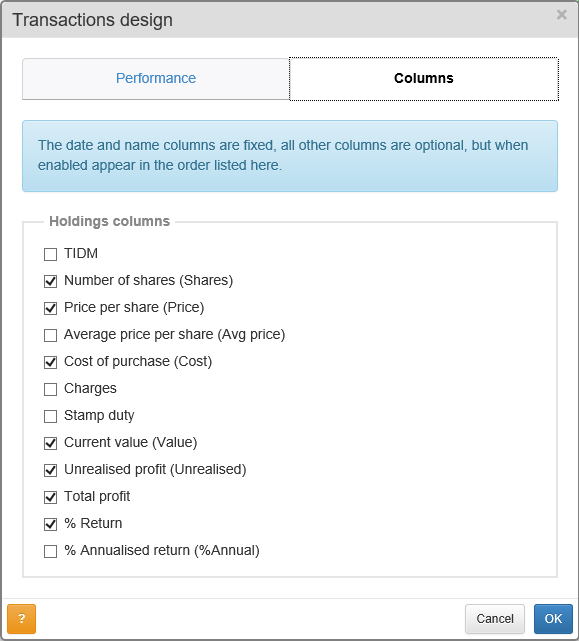
To edit the columns displayed in the Holdings table, click on the Design button, which is located at the bottom-left of the Trans view:
Related tutorials
- The Holdings view
- The Cash view
- The Value on date view
- The Tax view
- The Portfolio Valuation Chart
- Recording Transactions #1: Buys & Sells
- Recording Transactions #2: Credits & Debits
- Recording Transactions #3: Dividends, Scrip Dividends & Returns of Capital
- Recording Transactions #4: Splits & Consolidations